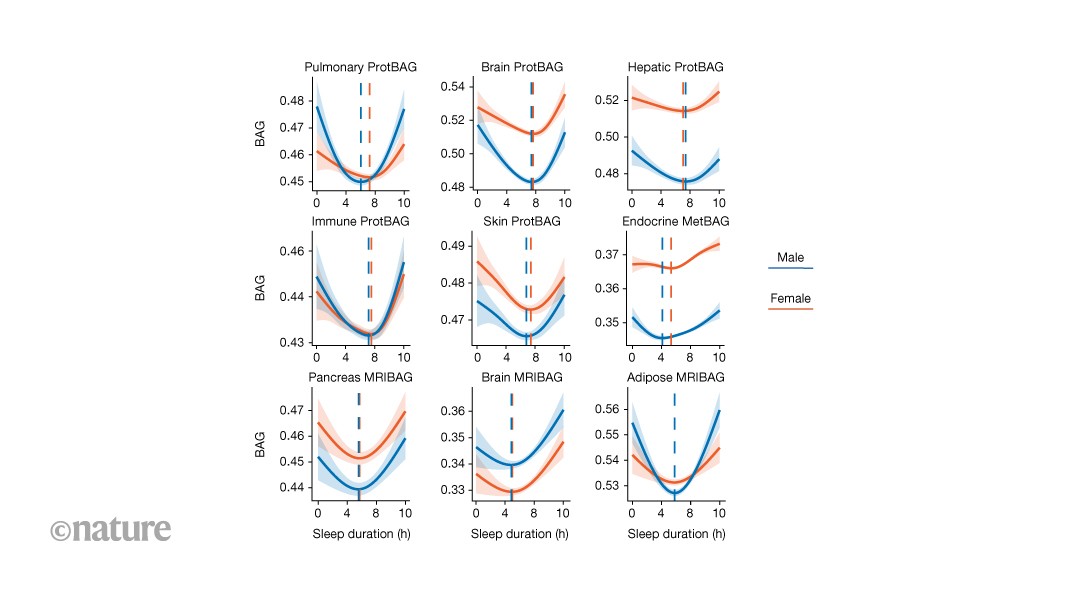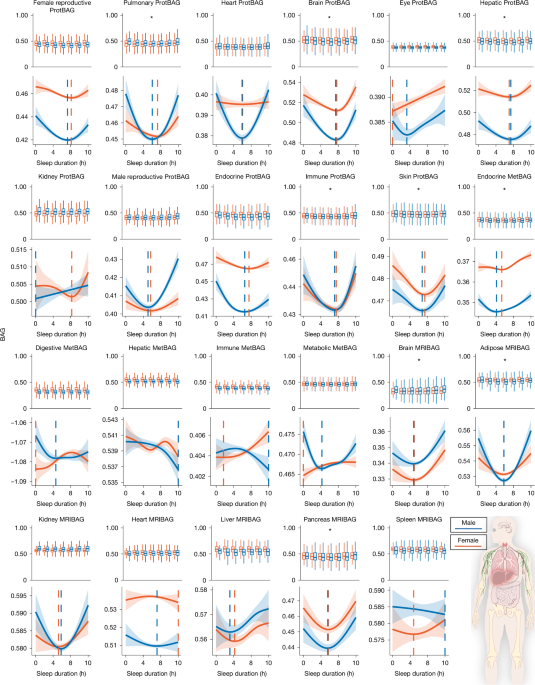
MainSleep is a fundamental biological process that is essential for physical restoration, cognitive functioning and overall health. Increasing evidence underscores its association with ageing4, disease susceptibility5 and longevity6. Both insufficient and excessive sleep duration have been linked to a wide range of adverse health outcomes, including cardiometabolic disease7, cognitive decline8 and psychiatric disorders, such as late-life depression (LLD)9. Importantly, sleep is probably modifiable, making it a potential target for promoting healthy ageing and reducing the burden of age-related diseases across the lifespan.In parallel, the field of ageing research has seen rapid progress through the development of biological ageing clocks derived from imaging and multi-omics data, like magnetic resonance imaging (MRIBAG)1,10, plasma proteomics (ProtBAG)2 and metabolomics (MetBAG)3. These clocks aim to quantify the biological age of individuals across organ systems and molecular layers, enabling a more granular understanding of ageing beyond chronological or calendar age. Organ-specific biological age gaps (BAGs) derived from these clocks have been used as intuitive and personalized biomarkers to quantify biological ageing and have shown great predictive value for disease morbidity, cognition and mortality risk11. This multi-organ, multi-omics ageing clock framework offers a promising avenue to model human ageing and disease in a multisystem and personalized manner.Previous studies have demonstrated a nonlinear, U-shaped relationship between sleep duration and several phenotype-based ageing clocks12,13,14,15, suggesting that both short (for example, <6 h) and long (for example, >8 h) sleep may accelerate neurobiological ageing. However, it remains unclear whether this relationship generalizes beyond the brain to body systems (that is, multi-organ)16,17,18,19 and omics layers (that is, multi-omics)2, and whether this relationship is similar in male and female individuals. This raises the questions of whether similar U-shaped patterns emerge in the structural, functional and molecular hallmarks of ageing in organs and tissues beyond the brain, and whether the observed U-shaped associations and empirically derived sample minimum values of the BAG–sleep relationships are consistent across different sexes and organ systems. To address these gaps, we used large-scale population biobanks, combining both individual-level and summary-level data, consolidated through the MULTI Consortium3,16,19 (Methods and Supplementary Table 1), to comprehensively map how sleep duration is associated with biological ageing across multiple systems and to elucidate the pathways through which disrupted sleep may drive age-related diseases and mortality. Our analysis focused on the UK Biobank’s (UKBB) questionnaire-derived sleep duration (field ID: 1160). Self-reported measures are less objective than actigraphy or polysomnography, capturing different yet complementary aspects of sleep biology, with only moderate correlations between modalities20. The large sample size (around 500,000) enables robust identification of nonlinear associations using generalized additive models (GAMs; Methods).This study addresses several scientific and clinical questions. First, we examined the nonlinear, U-shaped associations, without any prior assumption of the shape of the associations, between sleep duration and 23 multi-organ BAGs derived from multi-omics data (Fig. 1). We reinforced this pattern using in vivo imaging markers (Extended Data Fig. 1) and circulating molecular phenotypes, including plasma proteomics and metabolomics (Extended Data Figs. 2 and 3). Second, we assessed whether abnormal sleep duration patterns (that is, short or long sleep duration) were adversely associated with all-cause mortality and systemic disease end points (DEs) beyond the brain (Figs. 2 and 3). Third, we examined whether short and long sleep duration are differentially associated with two distinct subtypes of LLD9 through separate mediational pathways (Fig. 4). Finally, we examine whether sleep disturbances act as modifiable risk factors for disease (or genetic predisposition), consequences of disease burden or reflect a potential bidirectional relationship (Fig. 4, Extended Data Fig. 4 and Supplementary Note 4). All results, code and summary statistics are publicly available at the SleepChart portal (https://labs-laboratory.com/sleepchart).Fig. 1: Sleep Chart delineates U-shaped patterns between sleep duration and biological ageing clocks.The alternative text for this image may have been generated using AI.Full size imageSleep duration (x axis) exhibits nonlinear U-shaped relationships with 9 out of 23 BAGs across 17 organs and 3 omics types (y axis; units are normalized years based on the selected distribution): 11 ProtBAGs for plasma proteomics, 5 MetBAGs for plasma metabolomics and 7 MRIBAGs for in vivo MRI data. For each BAG, we fitted a GAM with cubic regression splines to assess the association between sleep duration and BAG, stratified by sex and sex–sleep interaction term. The solid curves depict the estimated BAG, while shaded bands represent the 95% CI. Significant signals (two-sided P < 0.05/23) are shown with asterisks. Sample-specific BAG minimum values (in hours) of sleep duration are displayed separately for male and female individuals. Sample sizes of each sleep–BAG association are presented in Supplementary Table 2. The image at the bottom right is from NIAID Visual & Medical Arts.Source dataFig. 2: Genetic evidence for a systemic landscape of abnormal sleep duration patterns compared to normal sleep duration.The alternative text for this image may have been generated using AI.Full size imagea, The top lead SNP, the nearest gene and cytogenetic regions associated with short (4–6 h) and long (8–10 h) sleep duration compared with a normal sleep duration (6–8 h), with significant genomic loci identified using the genome-wide significance threshold (two-sided P < 5 × 10⁻⁸). b, MAGMA gene property analysis of tissue-specific expression across 54 GTEx v.8 tissues. Statistical significance was determined using FDR-adjusted P values (<0.05). acc., accumbens; ecto., ectocervix; endo., endocervix; exp., exposed; GE, gastroesophageal; oesoph., oesophagus. c, Genetic correlation estimates based on the LDSC between the two abnormal sleep duration patterns and 527 DEs from FinnGen and PGC (two-sided P < 0.05/527). The error bars represent the s.e. of the LDSC genetic correlation (rg) estimate. An interactive webpage is available (https://labs-laboratory.com/sleepchart/sleep_gc.html) to facilitate visualization. Sample sizes of the FinnGen and PGC DEs are presented in Supplementary Table 7. CPAP, continuous positive airway pressure; T2D, type 2 diabetes. The diagrams in b and c were created using images from the Noun Project and NIAID Visual & Medical Arts.Source dataFig. 3: Clinical evidence for a systemic involvement of abnormal sleep duration patterns compared with normal sleep duration.The alternative text for this image may have been generated using AI.Full size imagea, Using normal sleep duration, 6–8 h as the reference, we treated sleep duration patterns as categorical variables (4–6 h for short sleep; 8–10 h for long sleep) to estimate their association with 726 comorbidity-free DEs defined by ICD-10 codes (limited to diseases with more than 50 cases). After applying Bonferroni correction for multiple comparisons (two-sided P < 0.05/726), we highlight the significant associations and annotate representative systemic diseases across various organ systems. IHD, ischaemic heart disease. b, Short and long sleep duration are associated with a higher risk of all-cause mortality. An interactive webpage is available (https://labs-laboratory.com/sleepchart/sleep_cox.html) to facilitate visualization. The error bars represent the 95% CIs of the hazard ratio (HR) estimate, which is represented by a central shape. The diagrams in a were created using images from the Noun Project and NIAID Visual & Medical Arts.Source dataFig. 4: Seven MRIBAGs mediate the effects of disturbed sleep duration patterns on two LLD subtypes.The alternative text for this image may have been generated using AI.Full size imageWe tested whether 7 MRIBAGs mediate the effect of abnormal sleep duration on two artificial-intelligence-derived subtypes of LLD (LLD1 and LLD2)9. The participants were grouped into short (4–6 h), normal (6–8 h; as a reference) and long (8–10 h) sleep categories: sleep duration → MRIBAG → LLD1/2. For each LLD subtype and each contrast (short versus normal, long versus normal), we fit structural equation models using the lavaan package in R. The model included a direct path from the binary-coded sleep category to the LLD subtype (depicted as solid lines with warm colours) and indirect paths mediated through the MRIBAG (shown as dotted lines with cool colours). Only statistically significant pathways (two-sided P < 0.05/7) and estimated path coefficients are displayed. All models were adjusted for relevant covariates, including age, sex, body mass index, and systolic and diastolic blood pressure, among others. Standardized estimates were obtained using 1,000 nonparametric bootstrap resamples. a, Mediational models for short sleep duration → MRIBAG → LLD1. b, Mediational models for long sleep duration → MRIBAG → LLD1. c, Mediational models for short sleep duration → MRIBAG → LLD2. d, Mediational models for long sleep duration → MRIBAG → LLD2. Our primary analyses were based on the temporal ordering of data collection, with sleep duration assessed at the baseline and both MRIBAG and LLD subtypes measured at the second visit. The sample sizes of the analyses are presented in Supplementary Table 8.Source dataTwenty-three biological ageing clocksUsing GAMs with the UKBB data, we assessed the nonlinear, U-shaped relationship between sleep duration and 23 multi-organ, multi-omics BAGs (P < 0.05/23; Fig. 1). We quantified nonlinearity in the sleep–BAG relationship using the effective degrees of freedom (e.d.f.) of the smooth term—a measure of curve complexity (Methods).We confirmed that 9 out of the 23 BAGs exhibited statistically significant nonlinear associations (P < 0.05/23). Among the 11 ProtBAGs, the brain ProtBAG showed the strongest U-shaped association with sleep duration (e.d.f. = 3.61, P1 < 1 × 10⁻²⁰). At the population mean level, female individuals exhibited significantly higher brain ProtBAG values than male individuals (P2 < 1 × 10⁻²⁰). The interaction between sex and sleep duration approached nominal significance (P3 = 0.06), indicating a potential trend toward sex-specific associations. We next estimated the sample minimum of the BAG–sleep curves based on the peak of the smoothed spline curves for the brain ProtBAG, identifying 7.82 h for female and 7.70 h for male individuals. Similar U-shaped relationships were also evident for the pulmonary (e.d.f. = 3.21, P1 = 1.09 × 10⁻⁴), hepatic (e.d.f. = 3.13, P1 = 1.36 × 10⁻³), immune (e.d.f. = 3.47, P1 = 1.78 × 10⁻⁵) and skin (e.d.f. = 3.21, P1 = 3.12 × 10⁻⁶) ProtBAGs. Among the 5 MetBAGs, the endocrine MetBAG showed a significant U-shaped relationship (e.d.f. = 1.04, P1 = 3.97 × 10⁻⁵), and the mean population value was different between female and male individuals (P2 < 1 × 10⁻²⁰, P3 = 5.72 × 10⁻⁷), with estimated sample minimum values of 6.67 h for female and 6.06 h for male individuals. Finally, among the 7 MRIBAGs, the brain MRIBAG showed the most significant U-shaped relationship (e.d.f. = 1.94, P1 = 3.85 × 10⁻⁷), and the mean population value was different between female and male individuals (P2 < 1×10⁻²⁰, P3 = 0.84). The optimal sleep time was 6.48 h for female and 6.42 h for male individuals. Significant signals were also observed for the adipose (e.d.f. = 1.93, P1 = 2.84 × 10⁻⁴) and pancreas (e.d.f. = 1.95, P1 = 9.95 × 10⁻⁶) MRIBAGs. Detailed statistics, including the P value, sample size, chosen family distribution and e.d.f., are provided in Supplementary Table 2 and Supplementary Data 1.Several sensitivity analyses were performed. Supplementary Fig. 1 displays quantile–quantile plots and residual versus fitted plots for the best model of each BAG. Supplementary Figs. 2–16 and Supplementary Table 3 present a full set of analyses to scrutinize the robustness of the U-shaped pattern, including a potential replication of the U-shaped relationship in two independent datasets21,22, although the sample sizes (n = 385 and 573) are much smaller and the populations are much older than in the UKBB. We also observed this U-shaped pattern between sleep duration and 720 organ-specific imaging-derived phenotypes (IDP; Extended Data Fig. 1), 342 organ-enriched plasma proteins (Extended Data Fig. 2 and Supplementary Fig. 17) and 107 organ-associated plasma metabolites (Methods, Extended Data Fig. 3 and Supplementary Data 2–4). A detailed discussion of these results and their implications in sleep-related hypotheses is presented in Supplementary Note 1.Overall, across the nine significant proteomic, metabolomic and MRI-based BAGs, sample minimum values for sleep duration ranged from 6.5 to 7.8 h for female individuals and 6.4 to 7.7 h for male individuals. Given the strong evidence of the U-shaped relationship across widespread biomarkers at both the imaging and molecular levels, we classified sleep duration into short (<6 h), long (>8 h) and normal (6–8 h) categories for all downstream analyses. Although our definition is data driven by the sample minimum value range observed, it is important to note that the definition of normal sleep varies between studies and is often associated with cultural and environmental factors.Systemic diseases and all-cause mortalityIn the UKBB, our genome-wide association study (GWAS; Methods) identified 8 genetic loci (P < 5 × 10⁻⁸) associated with abnormal sleep duration patterns (Fig. 2a). A locus at 3q29 (top lead single-nucleotide polymorphism (SNP): rs34382732) was associated with short sleep duration, whereas long sleep duration was linked to multiple loci, highlighting potential genetic heterogeneity between short and long sleep patterns. We denoted the genomic loci using their top lead SNPs defined by FUMA (Supplementary Note 2), considering linkage disequilibrium; the genomic loci are presented in Supplementary Table 4. The Manhattan plot and quantile–quantile plot, as well as the linkage disequilibrium score regression (LDSC)23 intercept, are presented in Supplementary Fig. 18. We then conducted gene–property analyses24 to assess tissue-specific expression patterns of genetic signals associated with short and long sleep duration, using gene expression data from 54 human tissues provided by the Genotype-Tissue Expression Program (GTEx) v.8. Notably, only short sleep duration demonstrated significant enrichment (false discovery rate (FDR)-corrected P < 0.05) in several brain regions, including the cerebellum, caudate and hippocampus (Fig. 2b), but not long sleep duration.Given the relatively smaller number of genomic loci in our GWASs, despite the large sample size (n > 300,000), we hypothesize that the U-shaped association between sleep duration and BAG is primarily environmentally driven and modifiable. As such, we hypothesized that this U-shaped pattern observed at the BAG level would be flattened and attenuated when examining BAG polygenic risk scores derived in our previous studies1,2,3,10. Our results supported our hypothesis (Extended Data Fig. 4). Notably, the endocrine MetBAG showed a J-shaped association, with higher genetic risk in individuals reporting shorter sleep duration, while the metabolic MetBAG demonstrated a linear relationship. Moreover, genetic correlation analyses revealed a significant positive correlation only between short sleep duration and endocrine MetBAG, and between long sleep duration and pancreas MRIBAG (P < 0.05/23) (Supplementary Table 5). These findings imply that, while most sleep–BAG relationships are not genetically mediated, certain organ systems, particularly endocrine and metabolic pathways, may share partial genetic underpinnings with habitual sleep duration.Using summary-level data from our GWAS in the UKBB, as well as those from FinnGen and Psychiatric Genomics Consortium (PGC) for 527 DEs, genetic correlation analyses revealed 153 positive associations between abnormal sleep duration and systemic diseases across multiple organ systems (P < 0.05/527), dominated by short sleep duration (Fig. 2c). For short sleep duration, we observed robust correlations with cardiovascular diseases, including ischaemic heart disease (gc = 0.19 ± 0.04, P = 2.52 × 10⁻⁶), heart failure (gc = 0.31 ± 0.06, P = 5.80 × 10⁻⁶) and coronary atherosclerosis (gc = 0.18 ± 0.04, P = 1.51 × 10⁻⁵); metabolic disorders, such as type 2 diabetes (gc = 0.18 ± 0.04, P = 5.33 × 10⁻⁵) and insulin-requiring diabetes (gc = 0.17 ± 0.04, P = 4.45 × 10⁻⁵); and musculoskeletal conditions, like low back pain (gc = 0.40 ± 0.06, P = 1.13 × 10⁻¹²), osteoarthritis (gc = 0.19 ± 0.05, P = 7.07 × 10⁻⁵) and soft tissue disorders (gc = 0.50 ± 0.06, P = 2.04 × 10⁻¹⁶). Neurological and psychiatric associations included migraine (gc = 0.25 ± 0.06, P = 1.91 × 10⁻⁵), depression (gc = 0.37 ± 0.04, P = 1.57 × 10⁻¹⁸), anxiety (gc = 0.32 ± 0.06, P = 1.83 × 10⁻⁷), substance-use disorders (gc = 0.37 ± 0.05, P = 3.73 × 10⁻¹⁵) and suicidality (gc = 0.34 ± 0.06, P = 4.28 × 10⁻⁸), indicating broad involvement of the central nervous system. Pulmonary and infectious conditions, such as asthma (gc = 0.22 ± 0.05, P = 2.50 × 10⁻⁵), bronchitis (gc = 0.42 ± 0.12, P = 5.00 × 10⁻⁴) and chronic obstructive pulmonary disease (gc = 0.28 ± 0.05, P = 2.74 × 10⁻⁷), were also genetically correlated, as were gastrointestinal and hepatic diseases, including reflux (gc = 0.34 ± 0.06, P = 6.09 × 10⁻⁸), diverticulosis (gc = 0.23 ± 0.04, P = 1.14 × 10⁻⁶) and irritable bowel syndrome (gc = 0.32 ± 0.09, P = 3.00 × 10⁻⁴). By contrast, long sleep duration showed a more focused genetic correlation profile, predominantly involving brain-related phenotypes, such as major depressive disorder (MDD; gc = 0.29 ± 0.04, P = 2.57 × 10⁻¹¹), schizophrenia (gc = 0.28 ± 0.03, P = 3.47 × 10⁻¹⁶), bipolar disorder (gc = 0.21 ± 0.03, P = 1.09 × 10⁻⁷), alcohol dependence (gc = 0.23 ± 0.05, P = 3.26 × 10⁻⁵), ADHD (gc = 0.28 ± 0.04, P = 2.24 × 10⁻¹²) and migraine (gc = 0.28 ± 0.07, P = 7.09 × 10⁻⁵), suggesting potential compensatory or indirect neuropsychiatric mechanisms (further elucidated in Fig. 4). Supplementary Data 5a presents detailed statistics for our genetic correlation analysis.Taken together, these findings support that short and long sleep duration have distinct genetic architectures (Fig. 2a). While both show genetic correlations with various systemic diseases, short sleep duration exhibits broader systemic associations, whereas long sleep duration is more specifically linked to brain-related traits (Fig. 2c). A discussion comparing our GWAS and genetic relevance with previous studies is provided in Supplementary Note 3, Supplementary Figs. 19–21 and Supplementary Data 5b,c.Using ICD code-based clinical diagnosis and echoing the genetic correlation results, we further assessed the relationships between abnormal sleep duration patterns and the future onset of DEs, as well as all-cause mortality, in the UKBB (Methods). We identified 153 significant associations between sleep duration patterns (both short and long) and DEs (P < 0.05/726), after correcting for multiple comparisons across end points with at least 50 cases (Fig. 3a), with a notable predominance of associations linked to short sleep duration (1.20 < hazard ratio < 6.69). These findings span multiple organ systems, supporting the systemic and direct association with disturbed sleep. Within the brain-related disorders, short sleep was significantly associated with depressive episodes (ICD code: F329), anxiety disorders (F419) and primary insomnia (G473), reinforcing the well-established link between sleep and mental health. In the metabolic domain, we observed associations with obesity (E669), type 2 diabetes (E119) and hyperlipidaemia (E780), aligning with previous evidence that short sleep disrupts metabolic homeostasis. Cardiovascular outcomes such as essential hypertension (I10), ischaemic heart disease (I209, I252) and arrhythmias (I471, I440) were also enriched, suggesting increased cardiovascular risk among individuals with short sleep. Pulmonary conditions, including chronic obstructive pulmonary disease (J449) and asthma (J459), were linked to both short and long sleep, although more strongly with short sleep. Finally, a cluster of digestive disorders, including gastritis and duodenitis (K297), gastroesophageal reflux disease (K219) and functional intestinal disorders (K590), was significantly predicted by both long and short sleep duration. These findings underscore the broad biological associations of both insufficient and prolonged sleep, highlighting distinct mechanistic pathways by which short and long sleep duration relate to systemic DEs (further elucidated in Fig. 4). We also performed a sensitivity analysis using 7–9 h as normal sleep duration (Supplementary Fig. 22), as suggested by the National Sleep Foundation25 for young/older adults.For all-cause mortality, we found that both short (hazard ratio = 1.50, 95% confidence interval (CI) = 1.44–1.55, P < 1 × 10⁻²⁰) and long sleep duration (hazard ratio = 1.40, 95% CI = 1.36–1.44, P < 1 × 10⁻²⁰) patterns were positively associated with increased risk of death from any cause (Fig. 3b). Supplementary Data 6 presents detailed statistics for all survival analyses. Supplementary Note 4, Supplementary Data 7 and Extended Data Fig. 5 present results of examining the associations between two sleep disorders (insomnia and hypersomnia) and the DEs, using the TriNetX dataset, identified in Fig. 3a, as well as all-cause mortality.From ageing clocks to LLDGiven that short sleep duration showed more significant associations with systemic DEs in our genetic correlation (Fig. 3a) and survival analysis (Fig. 3b) than long sleep duration, we hypothesize that long sleep may be linked to disease risk through more complex or indirect pathways, potentially serving as a marker of underlying health conditions or reflecting mediational, compensatory physiological responses rather than acting as a direct risk factor (Methods).To evaluate this hypothesis in the UKBB, we performed structural equation modelling using sleep duration patterns (short or long) as exposures, the 7 MRIBAGs as mediators and two MRI-derived subtypes of LLD (LLD1 and LLD2)9 as outcomes. We selected LLD as the outcome because it is closely linked to sleep disturbances (Figs. 2 and 3) and ageing, making it a compelling model to explore potential mediating pathways. In the pathway linking short sleep to LLD1, characterized by preserved subcortical brain volume, we observed strong direct effects (c2 ranging from −0.33 to −0.24) across 6 organ systems (the c1, c2, and a1 coefficients are defined in the Methods). Among the mediators, only the adipose MRIBAG showed a significant indirect effect (a1 = 0.44 ± 0.13, c1 = −0.05 ± 0.005), suggesting a specific role for adipose ageing in mediating this relationship. By contrast, for long sleep, the associations with LLD1 were predominantly mediated through organ-specific MRIBAGs, particularly the brain (a1 = 0.54 ± 0.08, c1 = −0.11 ± 0.002) and adipose (a1 = 0.61 ± 0.09, c1 = −0.04 ± 0.005) pathways. Notably, brain MRIBAG alone accounted for 62% of the total effect through mediation, followed by the adipose and liver MRIBAGs (24%), highlighting a more indirect and organ-mediated link between long sleep and LLD. Similar patterns were observed for LLD2, which were characterized by diffuse patterns of cortical atrophy in LLD (Fig. 4). All statistics for the mediation analyses are presented in Supplementary Data 8.Our mediation analysis treated sleep duration as a potential modifiable risk factor (not for causal inference), based on the temporal sequence of data collection: sleep data were recorded at the baseline, while brain MRI occurred during follow-up. As described in Supplementary Table 6, we conducted sensitivity analyses by alternately specifying brain MRIBAG and LLD1/2 as mediators and outcomes. However, due to the limitations of the data’s time-ordering, we cannot fully exclude the possibility that sleep disturbances result from underlying disease burden. To test this reverse causality, we conducted Mendelian randomization (MR) analyses using 5 different estimators (Supplementary Note 5 and Supplementary Data 9), from 525 DEs using FinnGen and PGC data, to the 2 binary sleep traits. These analyses did not support a widespread causal effect of disease on sleep disturbances, reinforcing the interpretation of sleep disturbances as potential risk factors. We nevertheless acknowledge the possibility of bidirectional effects. For example, a previous study26 found bidirectional causality between MDD and insomnia, but not sleep duration. Moreover, some previous studies modelled sleep duration as a continuous trait using linear MR, which does not capture potential nonlinear relationships that methods such as fractional polynomial MR can address27. To examine this further, we conducted additional sensitivity analyses focused on depression-related end points in our MR results. Specifically, depression in FinnGen (F5-DEPRESSION-DYSTHYMIA; number of cases, 48,222) was not causally linked to long sleep duration (P > 0.05). The sensitivity analyses results are presented in Extended Data Figs. 6 and 7, including the per-SNP F statistics, horizontal pleiotropy and heterogeneity test based on MR-Egger, and horizontal pleiotropy from MR-PRESSO and fractional polynomial MR.DiscussionHere we reveal a robust and systemic U-shaped association between sleep duration and biological ageing across organ systems and omics layers. By using large-scale multimodal data from the MULTI Consortium, we demonstrate that both short (<6 h) and long (>8 h) sleep duration are linked to elevated biological ageing burden across seven organ systems and three omics types. Importantly, our findings extend previous work on phenotype-based ageing clocks by showing that this nonlinear sleep–ageing relationship generalizes across the body and is evident not only in structural and functional imaging features but also at the molecular level. This is the first study, to our knowledge, that reveals a broad agreement between sleep duration and multi-organ, multi-omics ageing clocks and links these signatures to systemic disease outcomes and mortality risk. Our results underscore the systemic biological adverse associations of disturbed sleep and provide a compelling framework for more targeted and thoughtful attention to sleep disturbance as a potential signal of emerging health issues and a partner in the quest to promote healthy ageing, reduce disease risk and extend lifespan.The U-shaped patternA key contribution of this study lies in identifying consistent U-shaped associations between sleep duration and organ-specific biological ageing clocks across diverse organs, tissues and omics data types. At the molecular level, we observed that both short and long sleep duration are associated with accelerated pulmonary, brain, hepatic, immune and skin ProtBAGs, suggesting that proteomic signatures of ageing in these systems are particularly sensitive to sleep perturbations. These findings support sleep’s systemic implications on immune–inflammatory processes28, metabolic detoxification29 and neurodegenerative pathways30. Notably, endocrine MetBAG also exhibited a U-shaped pattern, highlighting the metabolic cost of sleep imbalance, possibly through dysregulation of hormonal homeostasis and glucose metabolism31. At the imaging level, U-shaped patterns in brain MRIBAG, adipose MRIBAG and pancreas MRIBAG further reinforce the idea that both central and peripheral organs experience structural and functional alterations under sleep extremes32.In addition to the overarching U-shaped pattern, our results reveal organ- and omics-specific variability in the sample-specific BAG minimum values of the BAG-sleep relationship. While the overall sample-specific minimum values centred between 6 and 8 h, consistent with previous epidemiological recommendations6, the precise inflection point varied across tissues and omics types. For example, brain ProtBAG showed the lowest ageing burden around 7.7 h of sleep, whereas brain MRIBAG reached its inflection point closer to 6.5 h. These findings suggest that molecular ageing in the brain may require longer restorative sleep than its structural counterpart, potentially reflecting the different timescales and mechanisms by which proteomic versus imaging phenotypes capture sleep-related damage or resilience32,33. Alternatively, this can be due to a reverse causality, where longer sleep reflects brain ageing rather than causes it, pulling the right side of the U-shaped curve upward, and making the apparent sample BAG minimum values appear shorter for the brain MRIBAG (for example, 6.5 h). Moreover, UKBB’s MRI subpopulation over-represents healthier and more highly educated participants; this may attenuate or distort the right limb of the observed U-shape independent of reverse causality. By contrast, the proteomic and metabolomic BAGs are derived from broader, potentially more representative samples spanning wider health states, which could partly explain their stronger or more symmetric associations. To summarize, the differing sample-specific BAG minimum values across organ-specific clocks probably reflect the heterogeneous physiological demands and recovery processes of each organ system. Organs such as the brain may be more sensitive to sleep deprivation and circadian disruption, whereas peripheral organs (for example, liver and pancreas) may exhibit delayed or compensatory responses, resulting in distinct sleep–ageing optima.Moreover, clear sex differences emerged in the relationship between sleep and biological ageing. Several organs displayed significant BAG differences, BAG-by-sex interactions, divergence in the population mean and sample minimum values of sleep time. For example, male individuals exhibited higher brain MRIBAG, whereas female individuals exhibited higher brain ProtBAG between sexes. This divergence probably reflects that these clocks index distinct layers of biology. The brain MRIBAG is driven by macrostructural MRI features (for example, regional volumes) that are shaped by lifelong neurodevelopmental trajectories, hormonal and sex-differential factors that have been repeatedly linked to sex differences in brain ageing and neurodegeneration. By contrast, brain ProtBAG is derived from circulating brain-enriched proteins, which may be more sensitive to systemic inflammatory/immune signalling, endocrine regulation, blood–brain barrier permeability, and glial- and vasculature-related processes that influence the release, transport or clearance of brain-linked proteins in the plasma. These differences may reflect sex-specific hormonal regulation, immune responses, activity patterns or metabolic demands, as well as socially unfavourable factors for female individuals, that probably relate to how sleep modulates ageing trajectories across organ systems—a concept supported by growing literature on sex-specific sleep physiology and ageing biology34.Together, these results reveal that deviations from sample-specific minimum BAG values of sleep duration are not only associated with the brain but also peripheral tissues and systems critical to cardiometabolic and immune regulation, emphasizing the multi-organ biological burden imposed by disrupted sleep.Molecular and imaging factorsOur findings provide converging evidence from imaging, proteomics and metabolomics that support the hypothesis that sleep duration exerts nonlinear effects across multiple organ systems and molecular domains. These patterns reflect the systemic nature of sleep physiology and are consistent with previous research showing that both sleep deprivation and prolonged sleep are associated with adverse outcomes across diverse biological pathways.At the imaging level, U-shaped associations between sleep duration and organ-specific IDPs, particularly in the brain, adipose tissue and pancreas, echo previous findings that link both short and long sleep with structural brain alterations and metabolic dysregulation. For example, previous neuroimaging studies have shown that hippocampal atrophy is associated with both insufficient and excessive sleep, possibly reflecting neurotoxic or neurodegenerative processes triggered by circadian misalignment, impaired glymphatic clearance or inflammatory load32,35. Similarly, adipose tissue dysfunction and pancreatic abnormalities underlie cardiometabolic conditions such as insulin resistance and obesity, both of which have been associated with extremes of sleep36.At the molecular level, the U-shaped relationships observed in organ-enriched plasma proteins align with several established biological hypotheses of sleep regulation. For example, immune-enriched proteins involved in neutrophil chemotaxis, complement activation and leukocyte signalling were significantly altered in individuals with suboptimal sleep. This supports the immune activation hypothesis, positing that sleep disturbances lead to, or reflect, systemic inflammation, impairing tissue repair, neurogenesis and metabolic homeostasis37. Similarly, hepatic-enriched proteins involved in coagulation and innate defence pathways reinforce the liver–sleep axis, in which disrupted sleep contributes to liver stress, oxidative damage and altered lipid metabolism38. Complementing these proteomic findings, the metabolomics results revealed alterations in metabolites involved in fatty acid metabolism, ketone body synthesis and amino acid catabolism. For example, the observed enrichment of pathways related to neurotransmitter transport and synaptic remodelling, such as tyrosine metabolism and Na+/Cl−-dependent transporter activity, supports the neurochemical plasticity hypothesis, suggesting that sleep modulates central nervous system function39 through fine-tuned molecular and ionic gradients that are essential for neural signalling.Together, our multilayered findings reinforce the notion that sleep duration is not only a behavioural or neurological variable but a deeply embedded systemic modulator. The evidence from both structural-functional imaging and circulating biomolecules converges to support the role of sleep in maintaining organ integrity, metabolic balance and immune equilibrium. These results further reinforce sleep as an important process with far-reaching molecular and physiological implications across the body.Evidence of adverse effects on healthOur integrated genetic and survival analyses consistently demonstrate that disturbed sleep duration patterns, both short and long, are robustly linked to a wide array of systemic DEs and increased mortality risk. Genetic correlation analyses revealed significant positive associations between abnormal sleep duration patterns and over 150 DEs across cardiovascular, metabolic, musculoskeletal, psychiatric, neurological, pulmonary and gastrointestinal systems, with short sleep duration exhibiting particularly widespread effects. These patterns were mirrored in our longitudinal survival analyses, where short and long sleep duration were both significantly associated with elevated risk for a broad spectrum of diseases and all-cause mortality. Importantly, the genetic and clinical evidence together suggest that short and long sleep duration may contribute to disease through distinct biological pathways: short sleep duration appears to exert more direct effects across multiple organ systems, potentially reflecting heightened physiological stress and systemic dysregulation, whereas long sleep duration shows a more focused association with neuropsychiatric and brain-related phenotypes, potentially reflecting compensatory mechanisms or underlying latent pathologies. These findings reinforce the role of sleep as a potentially modifiable risk factor in health and ageing management and underscore the need for mechanistically informed strategies tailored to sleep disruption, as we further illustrated in LLD.Mechanisms in LLDWhile MDD has been considered a brain-centric disorder, our findings suggest a more nuanced framework in which both short and long sleep duration link to LLD vulnerability through distinct mechanistic pathways involving multiple organ systems. Notably, short sleep duration appears to exert more direct effects on LLD. This pattern may reflect acute physiological stressors associated with sleep deprivation, including heightened sympathetic activity, immune dysregulation and hypothalamic–pituitary–adrenal axis activation, all of which can be linked to mood regulation independently of brain atrophy. These findings are consistent with previous studies linking short sleep to systemic inflammation, metabolic strain and emotional dysregulation, pointing to a fast-acting, body-to-brain pathway40.By contrast, long sleep duration appears to be associated with LLD predominantly through indirect pathways, especially through accelerated ageing in the brain and adipose tissue. The strong mediation effects observed for brain and adipose MRIBAGs suggest that long sleep may not be a direct risk factor per se, but rather a marker of underlying physiological compensations or subclinical disease processes, potentially including neurodegeneration, energy imbalance or immune exhaustion, that gradually erode mental health resilience. The finding also parallels a cultural illustration from Moshfegh’s novel My Year of Rest and Relaxation, in which an unnamed narrator methodically increases prescription medication to achieve a year-long sleep41 to escape her grief and the world. Such patterns support emerging views of long sleep as a complex, sometimes maladaptive response to latent morbidity rather than a simple behavioural choice42. The pronounced mediational roles of the brain and other body ageing clocks are particularly striking, indicating that central and systemic ageing may jointly drive mood vulnerability in individuals with prolonged sleep. This broader multi-organ involvement suggests that depression in late life might arise from distributed physiological ageing, in which systemic decline in tissues like adipose, liver or cardiovascular systems contributes to or exacerbates neural vulnerability. This is consistent with recent multidimensional models of depression that integrate metabolic dysfunction, systemic inflammation and neuroplasticity deficits as co-occurring drivers of depressive phenotypes43. Importantly, we used MR to partially rule out the possibility of reverse causality, whereby sleep disturbances may be caused by disease burden. While a previous study44 reported a bidirectional relationship between long sleep duration and MDD, their analysis relied on a lenient P-value threshold (P < 1 × 10⁻⁵) for selecting instrumental variables, which may cause weak instrument bias. We attempted to replicate their findings using the same PGC exposure GWAS as described in ref. 45 (45,396 cases, removing UKBB samples) using a genome-wide P-value threshold (P < 5 × 10⁻⁸). After LD clumping, no independent genome-wide significant instruments remained. To further investigate this, we downloaded the most recent MDD GWAS from FinnGen (59,333 cases). Overall, although the inverse variance weighted (IVW; P = 0.003) estimator suggested a positive causal effect of genetic liability, and the significant MR-Egger intercept (P = 0.047), MR-PRESSO global pleiotropy (P = 0.002) and high heterogeneity (P = 0.0009) indicate pleiotropy-induced biases. Pleiotropy-aware methods showed attenuated effects and were sensitive to pleiotropy assumptions (balanced versus directional pleiotropy), including MR-Egger for null/negative (P = 0.24), MRMix for near-null (P = 0.41) and MR-RAPS for nominally positive (P = 0.019). Thus, while suggestive, the evidence for a causal link between MDD and long sleep duration remains inconclusive and should be interpreted cautiously (Extended Data Fig. 7).Together, these findings highlight that, while short sleep may acutely disturb mood through direct neuroimmune and neuroendocrine perturbations, long sleep may reflect an organ-mediated pathway, linking chronic subclinical ageing processes to eventual neuropsychiatric decline. This distinction reinforces the need for tailored sleep interventions and underscores the importance of viewing LLD as a systemic, not merely cerebral, manifestation of ageing.LimitationsSeveral limitations warrant consideration. First, although our findings revealed U-shaped associations between sleep duration and various phenotypes, these patterns require external validation in independent cohorts, potentially on the same scale as UKBB. Second, the reliance on self-reported, questionnaire-based sleep duration measurement may introduce recall bias or misclassification; future studies incorporating objective measures, such as polysomnography, are essential to better understand underlying mechanisms. Third, the cross-sectional design of this study limits our ability to determine causality or the direction of effect; although our current analysis positions sleep disturbance as a modifiable risk factor, longitudinal follow-up is needed to clarify whether sleep disturbance is a modifiable risk factor or a consequence of disease burden. Furthermore, proteomic and metabolomic signals fluctuate with time, illness, medication and diet, so single snapshots can misclassify biology. Longitudinal sampling may yield more reliable estimates and separate transient noise from persistent, risk-relevant biology. Fourth, our analyses were restricted to individuals of predominantly European ancestry, which limits generalizability. Studies in more ethnically diverse and under-represented populations are needed to ensure broader applicability. Fifth, despite adjusting for a wide array of covariates, residual confounding and the potential for reverse causality, particularly for long sleep as a marker of subclinical illness, cannot be fully excluded. Moreover, circadian misalignment and sleep fragmentation were not directly assessed, which may influence the observed associations between sleep duration and organ-specific biological ageing. Sixth, future research needs to extend the Sleep Chart across the lifespan to better capture dynamic patterns of sleep duration beyond adulthood.MethodsThe MULTI ConsortiumThe MULTI Consortium is an ongoing initiative to integrate and consolidate existing multi-organ and multi-omics data, including imaging, genetics, metabolomics and proteomics. Building on existing consortia and studies, MULTI aims to curate and harmonize the data to model human ageing and disease at scale across the lifespan. Refer to Supplementary Table 1 for comprehensive information, including the complete list of data analysed and their respective sample characteristics. The participants provided written informed consent to the corresponding studies. The MULTI Consortium is approved by the Institutional Review Board at Columbia University (AAAV6751).UKBBUKBB46 is a population-based research initiative comprising around 500,000 individuals from the United Kingdom between 2006 and 2010. Ethical approval for the UKBB study has been secured, and information about the ethics committee can be found online (https://www.ukbiobank.ac.uk/learn-more-about-uk-biobank/governance/ethics-advisory-committee). The main sleep data used in this study were sleep duration (field ID: 1160) based on a self-reported questionnaire collected from all 500,000 participants at the baseline. The 7 brain MRIBAGs were derived from multi-organ MRI data at the second visit, 11 ProtBAGs and 5 MetBAGs were derived using plasma proteomics and metabolomics at the baseline. Finally, we also included individual plasma proteins and metabolites in our ProWAS and MetWAS, as described below.For the primary variable of interest in the UKBB, sleep duration (data-field: 1160) was assessed using an ACE touchscreen questionnaire asking “About how many hours sleep do you get in every 24 h? (please include naps).” The participants entered a numeric value, which underwent basic quality control: responses of less than 1 h or more than 23 h were rejected, and values below 3 h or above 12 h triggered a confirmation prompt. If participants clicked the ‘Help’ button, they were instructed that, if their sleep duration varied substantially, they should report the average number of hours slept in a 24-hour day over the past 4 weeks. For this variable, the value −1 indicates ‘Do not know’ and the value −3 indicates ‘Prefer not to answer’; these were excluded in the current work.For the multi-organ IDPs, we used multi-organ MRI data from eight organ systems and tissues (category ID: 100003), including the brain, heart, liver, pancreas, spleen, adipose and kidney, as well as eye OCT features. The MUSE atlas-derived brain IDPs from the T1-weighted MRI10 were used for the brain MRIBAG generation. We also used neural networks to analyse the raw cardiac MRI images in our previous study and returned them to the UKBB to extract heart-specific IDPs (category ID: 157), which were used to derive the heart MRIBAG. For the other organs’ IDPs, we used the pre-derived features from the UKBB (category ID: 105). For the plasma proteomics data, we downloaded the original data (category ID: 1838), which were analysed and made available to the community by the UKBB Pharma Proteomics Project (UKB-PPP)47. The initial quality control procedures were described in the original work48; we conducted additional quality-check steps as outlined in the ‘Proteome-wide associations’ section. We also imputed missing normalized protein expression values and defined the organ-specific proteins using the HPA platform (https://www.proteinatlas.org/), as detailed in our previous work. For the plasma metabolomics data, we downloaded the original data (category ID: 220), which were analysed and made available to the community by Nightingale Health in the UKBB. Additional quality check analyses were performed as detailed in the ‘Metabolome-wide associations’ section.FinnGenThe FinnGen49 study is a large-scale genomics initiative that has analysed over 500,000 Finnish biobank samples and correlated genetic variation with health data to understand disease mechanisms and predispositions. The project is a collaboration between research organizations and biobanks within Finland and international industry partners. For the benefit of research, FinnGen generously made its GWAS findings accessible to the wider scientific community (https://www.finngen.fi/en/access_results). This research used the publicly released GWAS summary statistics (version R9), which became available on 11 May 2022, after harmonization by the consortium. No individual data were used in the current study.FinnGen published the R9 version of GWAS summary statistics via REGENIE software (v.2.2.4)50, covering 2,272 DEs, including 2,269 binary traits and 3 quantitative traits. The GWAS model included covariates such as age, sex, the initial 10 genetic principal components and the genotyping batch. Genotype imputation was referenced on the population-specific SISu v.4.0 panel. We included GWAS summary statistics for 521 FinnGen DEs in our analyses (Supplementary Table 7).PGCPGC51 is an international collaboration of researchers studying the genetic basis of psychiatric disorders. PGC aims to identify and understand the genetic factors contributing to various psychiatric disorders such as schizophrenia, bipolar disorder, MDD and others. The GWAS summary statistics were acquired from the PGC website (https://pgc.unc.edu/for-researchers/download-results/), underwent quality checks and were harmonized to ensure seamless integration into our analysis. No individual data were used from PGC. Each study detailed its specific GWAS models and methodologies, and the consortium consolidated the release of GWAS summary statistics derived from individual studies. In the current study, we included summary data for 6 brain diseases (Supplementary Table 7).TriNetXTo evaluate real-world clinical outcomes associated with sleep traits, we used the TriNetX52 database (https://trinetx.com/)—a global federated health research platform that provides access to deidentified electronic medical records from over 70 healthcare organizations, encompassing more than 90 million patients. The TriNetX platform integrates clinical data, including diagnoses, medications, procedures and laboratory results, enabling large-scale observational analyses. We used this resource to assess associations between insomnia and hypersomnia and systemic disease outcomes across organ systems identified in the UKBB for short and long sleep duration (Fig. 3).Baltimore longitudinal study of ageingThe main goal of the BLSA is to understand the normal ageing process. Tracking physiological and cognitive changes over time aims to identify risk factors for age-related diseases, study patterns of decline and identify predictors of healthy ageing. BLSA53,54 brain MRI, self-reported, and actigraphy-derived sleep duration (n = 385) were used to compare and replicate the U-shaped pattern observed in the main analysis for the brain MRIBAG. For self-reported sleep duration, sleep duration was assessed using a standardized questionnaire item asking “On average, in the past month, how many hours of sleep did you get each night?”. The participants select from ordered categorical response options reflecting typical nightly sleep duration: more than 7 h; more than 6 h up to 7 h; more than 5 h up to 6 h; or 5 h or fewer. This measure captures habitual sleep duration over the previous month and represents participants’ perceived average nightly sleep. We also included participants who underwent wrist actigraphy. They were instructed to wear an Actiwatch-2 wrist actigraphy (Philips-Respironics) on their non-dominant wrist for seven consecutive 24 h periods. The devices continuously recorded activity counts and ambient light levels, and the participants were asked to press the event marker each time they intended to go to sleep (lights out) and when they got up to start their day55.The Multi-Ethnic Study of AtherosclerosisThe Multi-Ethnic Study of Atherosclerosis (MESA)21,22,56 is a medical research initiative involving over 6,000 men and women from six US communities. For this analysis, we included 573 participants with available brain MRI data, self-reported sleep duration measures, and relevant covariates such as age, sex and BMI. We leveraged the MESA cohort to attempt replication of the U-shaped association observed in the UKBB for the brain MRIBAG. Self-reported sleep duration is obtained from the Exam 5 Sleep Questionnaire, in which the participants report their habitual bedtimes and wake times separately for weekdays and weekends. The questionnaire includes items asking for bedtime and waketime in 24 h format, from which MESA derives weekday sleep duration and weekend sleep duration expressed in hours and minutes.GAM models the relationship between sleep duration and organ ageing clocks, IDPs, proteins and metabolitesTo model the association between sleep duration and the 23 multi-organ BAGs and any other phenotype, we implemented GAMs using the mgcv package in R. This approach enabled flexible modelling of complex relationships, whether linear, flat, sigmoidal or U-shaped, without requiring any prior assumptions about the underlying shape of the fitted curves. We adjusted for key demographic and physiological covariates (that is, age, sex, weight, height, waist circumference, BMI, assessment centre, diastole, systolic blood pressure, time differences for data collection (for MRIBAGs) and disease status). The participants reporting extremely short durations or those with missing sleep duration were excluded. The analysis was restricted to those reporting 4–10 h of sleep to reduce the influence of outliers. For each BAG, we fitted GAM with cubic regression splines (bs = ‘cr’) to smooth the nonlinear association between sleep duration and the BAG, considering sex and sex–sleep interaction term.Model selection was conducted by systematically evaluating combinations of smoothing dimensions (k = 3, 5, 10, 15, 20) and distribution families (Gaussian, t, and gamma). For each candidate model, the estimated e.d.f. and smoothing parameters were optimized internally through penalized maximum-likelihood estimation. The optimal model was defined as the one yielding the lowest Akaike information criterion, indicating the best balance between model fit and complexity, while ensuring that the e.d.f. did not approach the upper limit of the specified k, thereby avoiding overfitting. We tested (1) the main effect (sleep duration; P1); (2) sex difference in population mean (P2); and (3) sex–sleep interaction terms (P3) on each BAG. The solid curves in Fig. 1 depict estimated BAG, while shaded bands represent the 95% CI. Supplementary Fig. 1 provides diagnostic plots of model fit for the optimal model. The raw BAG values were normalized to the range (0, 1) to allow for the application of different family distributions in the model.Twenty-three multi-organ ageing clocksIn our previous work, we processed raw brain MRI data from the UKBB to extract 119 grey matter regions of interest (ROIs) from T1-weighted images, which were used to compute the brain MRIBAG. For the heart MRIBAG, we used 80 cardiac MRI-derived traits from a previous study57, which we had incorporated in an earlier study. Moreover, five abdominal MRIBAGs were derived from abdominal MRI data (category ID = 105) across multiple studies58,59,60,61,62,63, yielding a total of 7 MRIBAGs1. We also developed 11 ProtBAGs using UKBB plasma proteomics data2, along with 5 MetBAGs3 based on plasma metabolomics profiles. All 23 BAGs were developed using a nested cross-validation framework, adhering to best practices in machine learning to minimize overfitting and prevent data leakage2,64.In our previous studies1,2,3, we described in detail the population definition and cross-validation procedures used for model training, which we summarize here. Applying a coherent machine learning framework, we assessed the performance of age-prediction models. Hyperparameter tuning was performed through nested, repeated holdout cross-validation with 50 repetitions (80% training/validation and 20% testing). Specifically, we performed a grid search for fine-tuning model-specific hyperparameters. The within-distribution, holdout test dataset was held out to unbiasedly evaluate model performance (different from the 20% test dataset from the cross-validation).To rigorously train the age-prediction models, we first defined participants without any pathologies based on ICD code and clinical history as CN. We further split the CN into the following datasets:
Sleep chart of biological ageing clocks in middle and late life - Nature
A cross-organ, multi-omics U-shaped relationship between sleep duration and biological ageing clocks highlights the potential of sleep optimization to promote healthy ageing, lower disease risk and extend longevity.
15,858 words~72 min read