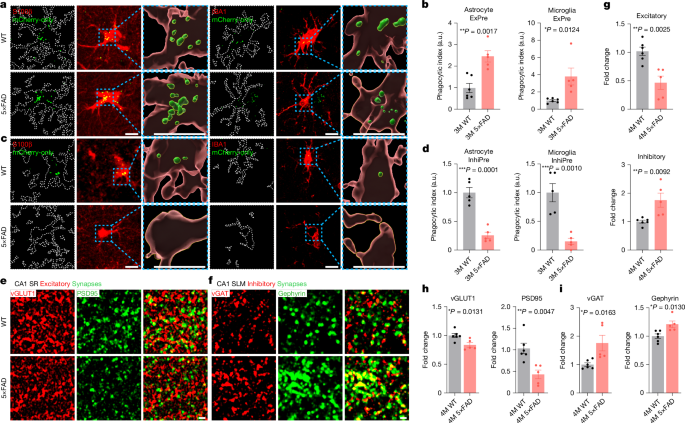
MainSynapse loss is evident across multiple brain regions from early stages of AD5,6. A prevailing model proposes that amyloid-β (Aβ) oligomers induce reactive microglial states and activate complement-dependent phagocytic programs, leading to excessive synapse elimination1,2,3,4. Previously, we revealed that astrocytes have a major role in the continuous elimination of both excitatory and inhibitory synapses in the normal adult hippocampus7. This astrocytic elimination of adult hippocampal synapses is highly dependent on hippocampal activity and has a critical role in maintaining circuit homeostasis and memory function7. As most research on the mechanisms of synapse loss in AD has focused on microglia and excitatory synapses, we initially set out to determine the contribution of astrocytes to the elimination of both excitatory and inhibitory synapses during AD progression.Here we found that altered glial synapse elimination arises as a result of gene expression and functional changes in AD excitatory neurons. Using single-nucleus RNA-sequencing (snRNA-seq), gene set enrichment analysis (GSEA), weighted gene correlation network analysis (WGCNA) and candidate gene approach, we identified a single responsible pathway, an ectopically expressed ERBB4 tyrosine kinase receptor in excitatory neurons, as a key disease-promoting factor orchestrating broad aspects of AD pathophysiology. CRISPR-based Erbb4 knockout in excitatory neurons of the 5×FAD mouse model substantially normalized excitatory neuronal hyperactivity, inhibitory neuronal hypoactivity, abnormal synapse elimination, reactive gliosis and even Aβ accumulation, leading to significant recovery of cognitive functions. Conversely, restricted Erbb4 overexpression in wild-type (WT) excitatory neurons reproduced major AD-like phenotypes in the absence of Aβ plaques through downstream mTOR signalling. Human AD tissue and transcriptomic analyses further linked excitatory neuronal ERBB4 to amyloid and tau pathology and cognitive decline. These findings support a model in which early excitatory neuronal dysfunction, mediated by aberrant Erbb4 expression, precipitates maladaptive glial responses and synaptic imbalance, promoting cognitive decline and neurodegeneration.Opposing synapse elimination by AD gliaWe monitored glial synapse engulfment using ExPre and InhiPre reporters, in which acid-labile eGFP undergoes denaturation and loses fluorescence in acidic phagolysosomes, whereas acid-resistant mCherry remains fluorescent, thereby distinguishing intact from engulfed pre-synapses7,8 (Extended Data Fig. 1a). ExPre was expressed in hippocampal CA3 excitatory projections and analysed in the stratum radiatum (SR) of the hippocampal CA1, where Schaffer collateral synapses predominate. InhiPre was expressed in CA1 inhibitory neurons and analysed in the stratum lacunosum moleculare (SLM), which is enriched in somatostatin (SST)-positive inhibitory synapses9. After reporter delivery to WT and APP/PS1 mice, we quantified astrocytic and microglial engulfment from 3 to 18 months to compare ageing- and AD-associated changes (Extended Data Fig. 1b–e).Across APP/PS1 progression, excitatory pre-synapse elimination by both astrocytes and microglia progressively increased, whereas inhibitory pre-synapse elimination decreased (Extended Data Fig. 1b–e). Astrocytic changes were evident by 6 months and preceded comparable microglial changes. A similar opposing pattern emerged in the more rapidly progressing 5×FAD model at 3 months, but not at 2 months, coinciding with the appearance of hippocampal Aβ plaques (Fig. 1a–d and Extended Data Fig. 1f–i). Astrocytes engulfed more synapses than microglia across synapse types, ages and mouse models (Extended Data Fig. 1j,k), suggesting that they are major early responders to synaptic perturbation. No sex-dependent differences in phagocytosis were detected (Extended Data Fig. 2a–d).Fig. 1: Differential elimination of excitatory and inhibitory synapses by AD glia.a,c, Representative confocal z-stack images of mCherry-only puncta from ExPre (a, green) and InhiPre (c, green), along with astrocytes (S100β) and microglia (IBA1) (red) in the CA1 of 3-month-old (3M) WT and 5×FAD mice. The white dotted lines indicate the outlines of glial cells. Right, enlarged three-dimensional reconstructions of the blue dotted boxes in the middle panels, highlighting engulfed mCherry-only puncta (green) inside glial cells (burgundy). Scale bars, 10 μm. b,d, Quantification of engulfed excitatory (b) and inhibitory (d) pre-synapses by astrocytes (left) and microglia (right). n = 6 (WT) and 5 (5xFAD) (b); n = 5 (WT) and 5 (5xFAD) (d). a.u., arbitrary units. e,f, Representative confocal single-plane images of excitatory (e; pre-synapse: vGLUT1, red; post-synapse: PSD95, green) and inhibitory (f; pre-synapse: vGAT, red; post-synapse: gephyrin, green) synapses in the CA1 of 4-month-old WT and 5×FAD mice. Scale bars, 1 μm. g–i, Quantification of the excitatory (h) and inhibitory (i) synapses with their colocalization (excitatory (g, top) and inhibitory (g, bottom)). n = 6 and 5 (g–i). Statistical analysis was performed using two-sided unpaired Student’s t-tests; *P < 0.05, **P < 0.01. Data are mean ± s.e.m. n values represent the number of mice per group.Source dataSynapse numbers were unchanged in the 2- and 3-month-old cohorts but, by 4 months, 5×FAD mice had fewer excitatory synapses in the SR and more inhibitory synapses in the SLM compared with the WT controls (Fig. 1e–i and Extended Data Fig. 2e–l). These findings, in which changes in synapse numbers are negatively correlated with the extent of synapse engulfment by glial cells, suggest that glial phagocytosis may regulate excitatory as well as inhibitory synapse numbers in AD brains. Furthermore, the selective elimination of excitatory synapses, coupled with reduced elimination of inhibitory synapses, raises the possibility that intrinsic neuronal states may guide glial phagocytic behaviour and that indiscriminate neuroinflammation is unlikely to be the sole driver of synapse elimination in AD.Notably, excitatory neurons become hyperactive, whereas inhibitory neurons become hypoactive, early in AD10,11,12. As glial synapse elimination is neuronal activity dependent7,13,14, we hypothesized that early alterations in neuronal activity in AD brains may misguide glial phagocytic processes, leading to aberrant synapse elimination. To modulate intrinsic neuronal activity, human Gq- or Gi-coupled muscarinic designer receptors (hM3Dq or hM4Di) were expressed selectively in excitatory or inhibitory neurons, followed by four daily clozapine-N-oxide (CNO) injections and confirmation of activity changes by FOS immunoreactivity (Extended Data Fig. 3). Importantly, glial synapse phagocytosis was increased with heightened neuronal activity and decreased when neuronal activity was suppressed in both excitatory and inhibitory neurons (Extended Data Fig. 3). These data suggest that imbalanced neuronal activity, characterized by excitatory neuronal hyperactivity and inhibitory neuronal hypoactivity, may shape abnormal patterns of glial synapse elimination in AD brains.To test whether astrocytic phagocytosis directly contributes to excitatory synapse loss, we knocked down the astrocyte-enriched phagocytic receptor MEGF10 in CA1 of 5×FAD mice using two AAV-encoded shRNAs7 (Extended Data Fig. 4a–c). Megf10 knockdown increased the number of excitatory synapses without affecting inhibitory synapses (Extended Data Fig. 4d–g), consistent with a selective requirement for MEGF10 in excitatory synapse elimination6.snRNA-seq reveals Erbb4 in ERENsTo determine the molecular mechanisms underlying early alterations in neuronal activity and corresponding synapse elimination in AD brains, we performed hippocampal snRNA-seq analysis in 3-month-old WT, 2-month-old 5×FAD and 3-month-old 5×FAD mice. After SysVI batch integration15, excitatory neurons showed the most prominent disease-associated shift on uniform manifold approximation and projection (UMAP) plots (Fig. 2a). Subclustering separated excitatory neurons into ten clusters (Fig. 2b and Supplementary Fig. 1a,b) and identified clusters 5–9 as selectively enriched in 3-month-old 5×FAD mice (Extended Data Fig. 5a). Their differentially expressed genes (DEGs) were enriched for Kyoto Encyclopedia of Genes and Genomes (KEGG) pathways associated with AD, Huntington’s disease (HD), Parkinson’s disease and amyotrophic lateral sclerosis (ALS) (Fig. 2c). As these transcriptional alterations appeared early and were more pronounced than changes in astrocytes or microglia (Extended Data Fig. 5b), we designated these clusters early-responsive excitatory neurons (ERENs).Fig. 2: snRNA-seq reveals aberrant Erbb4 expression in ERENs.a, UMAP plots showing total cell clusters and annotated brain cells from the hippocampi of 3-month-old WT, 2-month-old 5×FAD and 3-month-old 5×FAD mice. DGC, dentate granule cells; ExN, excitatory neurons; InN, inhibitory neurons; astro, astrocytes; micro, microglia; oligo, oligodendrocytes; OPC, oligodendrocyte progenitor cells. The red dotted circles indicate UMAP differences in the excitatory neuronal populations across groups. b, UMAP plots of the excitatory neuronal clusters with annotations. The red dotted circles indicate clusters enriched in the excitatory neurons of 3-month-old 5×FAD mice. c, GSEA results based on KEGG pathways enriched in ERENs. d, DEGs between EREN clusters and other excitatory neuronal clusters. Genes from the turquoise module are highlighted by turquoise-coloured clouds. e, DEGs of ERENs; selected genes are annotated on the basis of adjusted P value and average log2-transformed fold change (FC). f, GSEA results based on Reactome pathways enriched in turquoise module genes. All snRNA-seq comparisons used cells from two mice per group; cell numbers are reported in the Methods. g, Representative confocal z-stack images of NeuN (red), ERBB4 (green) and PV (cyan) in the CA1 of 3-month-old WT and 5×FAD mice. The cyan arrows indicate ERBB4+ PV neurons. Scale bar, 100 μm. h, Quantification of the ratio of ERBB4+ pyramidal neurons to the number of pyramidal neurons. n = 6 per group. Statistical analysis was performed using one-sided permutation tests (c, f), one-sided Wilcoxon rank-sum tests (d, e) and two-sided unpaired Student’s t-tests (h). ****P < 0.0001. Padj, adjusted P. Data are mean ± s.e.m. n values represent the number of mice per group.Source dataNext, we performed WGCNA16,17 of excitatory neuronal genes and identified ten distinct gene modules (Extended Data Fig. 5c,d). Among these, ERENs exhibited a significantly elevated module score only for the turquoise module (Fig. 2d and Extended Data Fig. 5c). For further analysis, we selected the top 25% of turquoise module genes that were differentially expressed between ERENs and other excitatory neuronal clusters, ranked by adjusted P value and expression level (Fig. 2e and Supplementary Fig. 1c). Among these top-ranked genes, Erbb4 was the only gene that overlapped with Reactome pathway terms enriched by GSEA, prompting us to prioritize ERBB4 signalling for subsequent analyses (Fig. 2f). Independent analysis of cortical neurons from 7-month-old 5×FAD mice18 similarly identified an expanded Erbb4high excitatory subset and firebrick module enriched in this subset (Extended Data Fig. 5e,f). Reactome GSEA again identified signalling by ERBB4 as the only significantly enriched pathway among firebrick-module genes (Extended Data Fig. 5g,h), supporting ERBB4 signalling as a conserved feature of EREN-like states.While Erbb4 has been known to be exclusively expressed in parvalbumin (PV)+ inhibitory neurons in the central nervous system, where it contributes to synaptogenesis through the mTOR pathway19, its expression and function in excitatory neurons remain unclear. To validate our findings, we performed immunohistochemistry and observed a significant upregulation of ERBB4 in the CA1, but not in the CA3, of 3-month- and 4-month-old 5×FAD mice compared with WT mice (Fig. 2g,h and Extended Data Fig. 5i). Consistently, fluorescence in situ hybridization (FISH) analysis revealed a significant increase in nuclear Erbb4 mRNA in pyramidal neurons within the CA1 hippocampus of 5×FAD mice (Extended Data Fig. 5j,k).EREN abundance was unchanged in Trem2-deficient 5×FAD mice18 (Extended Data Fig. 5l), arguing against an essential role for TREM2-dependent disease-associated microglia (DAM) in their generation. Conversely, CA1 injection of Aβ oligomers induced excitatory neuronal ERBB4 within 2 days (Extended Data Fig. 5m,n). These findings suggest that Aβ can promote ectopic Erbb4 expression in excitatory neurons, at least partly independently of TREM2-mediated microglial activation.Reducing Erbb4 mitigates AD pathologyTo determine the functional role of ERBB4 in AD pathology, we selectively deleted Erbb4 expression in excitatory neurons by delivering an AAV encoding a CaMKIIα promoter-driven Staphylococcus aureus Cas9 (SaCas9) along with a U6 promoter-driven single guide RNA (sgRNA) targeting Erbb4 into CA1 of 4-month-old 5×FAD mice (Fig. 3a and Extended Data Fig. 6a). This approach reduced ERBB4 in pyramidal neurons without altering its expression in PV interneurons (Fig. 3b,c and Extended Data Fig. 5j,k). Importantly, Erbb4 deletion reduced excitatory pre-synapse elimination and increased inhibitory pre-synapse elimination by both astrocytes and microglia in the AAV-injected 5×FAD mice, restoring values towards those in WT mice (Fig. 3d–g). It also rescued the loss of excitatory pre-synapses and post-synapses and the increase in inhibitory pre-synapses (Extended Data Fig. 6l–o).Fig. 3: Reducing Erbb4 in ERENs rescues AD pathophysiology.a, Schematic of CRISPR-AAV-mediated Erbb4 deletion in the CA1 of 4-month-old 5×FAD mice. The diagram was created using BioRender; Chung, W. https://Biorender.com/jotrdxh (2026). b, Representative confocal z-stack images of NeuN (red), ERBB4 (green) and PV (cyan). The cyan arrows indicate ERBB4+ PV neurons. Scale bar, 100 μm. c, Quantification of ERBB4+ pyramidal neurons as the proportion of total pyramidal neurons. n = 7 mice per group. d,f, Representative confocal z-stack images of mCherry-only puncta from ExPre (d, green) and InhiPre (f, green), along with astrocytes (S100β) or microglia (IBA1) (red). The white dotted lines indicate the outlines of glial cells. Right, magnified three-dimensional reconstructions of the blue dotted boxes in the middle panels, highlighting engulfed mCherry-only puncta (green) inside glial cells (burgundy). Scale bars, 10 μm. e,g, Quantification of the engulfed excitatory (e) and inhibitory (g) pre-synapses by astrocytes (left) and microglia (right). n = 6 mice per group. h,i, Representative confocal z-stack images of FOS (green) with NeuN (h, red) or SST (i, red). The green dotted boxes indicate the magnified regions (i). Scale bars, 100 μm. j,k, Quantification of the ratio of FOS+ pyramidal neurons (j) and FOS+ SST neurons (k) to the number of pyramidal or SST neurons, respectively. n = 8 mice per group (j), and n = 6 mice per group (k). l, Representative confocal z-stack images of S100β (left), GFAP (middle) and IBA1 (right). Scale bars, 10 μm. m, Quantification of the areas of S100β (left), GFAP (middle) and IBA1 (right). n = 6 mice per group. n, Representative confocal z-stack images of Aβ plaques. SO, stratum oriens; Pyr, pyramidal layer. Scale bar, 100 μm. o, Quantification of the fold changes in the number (left) and area (right) of Aβ plaques. n = 6 mice per group. Statistical analysis was performed using two-sided unpaired Student’s t-tests. Data are mean ± s.e.m.Source dataConsistent with previous reports20, assessment of neuronal activity through FOS immunoreactivity in the CA1 revealed an increased the number of FOS+ excitatory neurons in 5×FAD mice compared with in WT mice (Extended Data Fig. 6d,f). Notably, Erbb4 deletion in excitatory neurons strongly normalized the hyperactivity of excitatory neurons in 5×FAD mice (Fig. 3h,j). Conversely, the number of FOS+ SST neurons, which was significantly lower in 5×FAD mice than in WT mice (Extended Data Fig. 6e,g), was also strongly restored to WT levels after excitatory neuronal Erbb4 deletion (Fig. 3i,k). The number of FOS+ PV neurons remained unchanged in 4-month-old 5×FAD mice, regardless of Erbb4 manipulation (Extended Data Fig. 6h–k), indicating subtype-specific FOS changes in AD interneurons. These findings place aberrant excitatory neuronal ERBB4 upstream of excitatory hyperactivity, SST hypoactivity and the corresponding changes in synapse-selective glial phagocytosis. The restoration of SST activity despite Erbb4 deletion being confined to excitatory neurons further indicated that ERBB4-dependent dysfunction propagates through local circuit interactions rather than remaining cell-autonomous.Given the association between abnormal neuronal activity and neuroinflammation in AD21, we next evaluated reactive gliosis by quantifying S100β, GFAP and IBA1 levels in 5×FAD mice with or without CA1 excitatory neuronal Erbb4 deletion. Notably, the 5×FAD mice with excitatory neuronal Erbb4 deletion exhibited significantly reduced levels of all three reactive gliosis markers (Fig. 3l,m), along with a reduction in AXL+ microglia, indicative of a diminished DAM population (Extended Data Fig. 6p,q). Moreover, we found that amyloid plaque burden, measured by both plaque area and number, was strongly reduced in 4-month-old 5×FAD mice after excitatory neuronal Erbb4 deletion (Fig. 3n,o). These results suggest that aberrant Erbb4 expression in ERENs not only disrupts synaptic homeostasis but also drives gliosis and plaque deposition. Importantly, the same AAV-mediated deletion of Erbb4 in WT CA1 excitatory neurons did not elicit detectable changes in synapse phagocytosis or reactive gliosis (Extended Data Fig. 6r–w), thereby highlighting excitatory neuronal ERBB4 as a promising therapeutic target for AD pathophysiology.To determine whether normalization of excitatory activity was sufficient to reproduce the effects of Erbb4 deletion, we expressed hM4Di in CA1 excitatory neurons of 5×FAD mice. After four consecutive days of CNO injections, we found that activating hM4Di in AD excitatory neurons not only reduced the number of FOS+ excitatory neurons, but also increased the number of FOS+ SST neurons in 5×FAD mice (Extended Data Fig. 7a–e), supporting abnormal excitatory control over SST neurons in AD brains. Excitatory neuronal Erbb4 deletion also reduced the number of FOS+ vasoactive intestinal peptide (VIP) interneurons (Extended Data Fig. 6b,c). As VIP interneurons inhibit SST neurons22, these results are consistent with a potential excitatory neuron–VIP–SST disinhibitory circuit linking ERBB4-dependent excitatory hyperactivity to SST hypoactivity. Suppression of excitatory neuronal activity also decreased excitatory synapse phagocytosis by astrocytes and increased inhibitory synapse phagocytosis by both astrocytes and microglia (Extended Data Fig. 7f–i). However, despite normalization of neuronal activity and synapse phagocytosis, acute hM4Di activation did not reduce gliosis or amyloid plaques (Extended Data Fig. 7j–m), in contrast to Erbb4 deletion. These data suggest that ERBB4-expressing excitatory neurons initiate multiple aspects of AD pathophysiology by disrupting neuronal network activity. However, reactive gliosis may arise through ERBB4-dependent but neuronal-activity-independent mechanisms that have yet to be identified.Finally, we tested durability and therapeutic timing. Erbb4 deletion at 3 months reduced reactive gliosis, AXL+ or TREM2+ DAM, and amyloid deposition when mice were analysed at 7 months (Extended Data Fig. 8a–h). Delivery at 8 months likewise reduced these pathological features at 10 months (Extended Data Fig. 8i–p). Thus, reducing excitatory neuronal Erbb4 produced sustained benefits and remained effective when initiated after substantial disease progression.Ectopic Erbb4 induces AD-like pathologyWe next examined whether ectopic Erbb4 expression in WT excitatory neurons was sufficient to induce AD-like changes. A CaMKIIα-driven Erbb4 AAV was delivered to the CA1 of 2-month-old WT mice, with the viral dosage adjusted so that 5–15% of pyramidal neurons expressed ERBB4, matching the proportion observed in 5×FAD mice (Fig. 4a–c). Importantly, ERBB4 overexpression increased excitatory and decreased inhibitory synapse engulfment by both astrocytes and microglia (Fig. 4d–g), increased FOS+ excitatory neurons, reduced FOS+ SST neurons and left PV activity unchanged (Fig. 4h–k and Extended Data Fig. 9a,b). Along with these changes, the number of excitatory synapses was decreased while the number of inhibitory synapses was increased (Extended Data Fig. 9c–f), recapitulating the excitatory–inhibitory imbalance observed in 5×FAD mice. ERBB4 overexpression also elevated GFAP, S100β, IBA1 and AXL+ microglia without detectable cleaved caspase-3+ apoptosis (Fig. 4l–n and Extended Data Fig. 9g,h). By contrast, a kinase-dead ERBB4 mutant (K751M) did not alter synapse phagocytosis or gliosis (Extended Data Fig. 9i–q). Thus, ERBB4 kinase activity in excitatory neurons is sufficient to drive major AD-like neuronal, synaptic and glial phenotypes.Fig. 4: Ectopic Erbb4 expression in excitatory neurons induces AD-like pathophysiology.a, Schematic of Erbb4-expressing AAV-injection into the CA1 of 2-month-old WT mice. The diagram was created using BioRender; Chung, W. https://Biorender.com/jotrdxh (2026). b, Representative confocal z-stack images of NeuN (red), ERBB4 (green) and PV (cyan). The cyan arrows indicate ERBB4+ PV neurons. Scale bar, 100 μm. c, Quantification of the ratio of ERBB4+ pyramidal neurons to the number of pyramidal neurons. n = 6 mice per group. d,f, Representative confocal z-stack images of mCherry-only puncta from ExPre (d, green) and InhiPre (f, green), and glial cells (red, astrocytes: S100β; microglia: IBA1). The white dotted lines indicate the outlines of glial cells. Right, magnified three-dimensional reconstructions of the blue dotted boxes in the middle panels, highlighting engulfed mCherry-only puncta (green) inside glial cells (burgundy). Scale bars, 10 μm. e,g, Quantification of the engulfed excitatory (e) and inhibitory (g) pre-synapses by astrocytes (left) and microglia (right). n = 5 (HA) and 6 (Erbb4) (e, left), n = 6 mice per group (e, right), and n = 5 mice per group (g). h,i, Representative confocal z-stack images of FOS (green) with NeuN (h, red) or SST (i, red). The green dotted boxes indicate the enlarged regions (i). Scale bars, 100 μm. j,k, Quantification of the ratio of FOS+ pyramidal neurons (j) and FOS+ SST neurons (k) to the number of pyramidal neurons and SST neurons, respectively. n = 6 mice per group (j), and n = 6 (HA) and 8 (Erbb4) (k). l, Representative confocal z-stack images of S100β (left), GFAP (middle) and IBA1 (right). Scale bars, 10 μm. m, Quantification of the areas of S100β (left), GFAP (middle) and IBA1 (right). n = 6 mice per group. n, Representative confocal z-stack images of AXL (green) and IBA1 (red). Scale bar, 10 μm. Statistical analysis was performed using two-sided unpaired Student’s t-tests. ***P < 0.001. Data are mean ± s.e.m. n values represent the number of mice per group.Source dataErbb4 expression in cortical excitatory neurons similarly increased neuronal FOS activity and S100β, GFAP and IBA1 levels (Extended Data Fig. 9r–u). Together with the cortical EREN-like population identified in 7-month-old 5×FAD mice, these findings indicate that ectopic ERBB4 can promote AD-like neuronal and glial changes beyond the hippocampus.ERBB4 alters excitatory neuron functionAs aberrant ERBB4 signalling altered both excitatory and inhibitory synapse numbers, we next examined whether these structural changes altered synaptic input onto CA1 pyramidal neurons. Whole-cell recordings were performed at 4 months, when ERBB4-dependent synapse changes first became evident in 5×FAD mice. Analysis of miniature excitatory postsynaptic currents (mEPSCs) revealed a reduced event frequency in 5×FAD mice compared with in the WT controls, and this reduction was restored to WT levels by excitatory-neuron-specific Erbb4 deletion (Extended Data Fig. 7n–p). Conversely, Erbb4 overexpression in WT excitatory neurons reduced the mEPSC frequency to levels comparable to those observed in 5×FAD mice (Extended Data Fig. 7n–p). By contrast, the mEPSC amplitude remained unchanged across groups (Extended Data Fig. 7o). Together, these data indicate that ERBB4 primarily decreases the number of functional excitatory inputs rather than changing postsynaptic strength at individual synapses.Despite increased inhibitory presynaptic density in the SLM, both the frequency and amplitude of miniature inhibitory postsynaptic currents (mIPSCs) recorded from 5×FAD CA1 pyramidal neurons were reduced compared with WT controls (Extended Data Fig. 7q–s). Moreover, Erbb4 modulation in 5×FAD mice did not produce statistically significant changes in either mIPSC frequency or amplitude (Extended Data Fig. 7q–s). However, Erbb4 overexpression in WT excitatory neurons showed a trend toward increased mIPSC frequency, consistent with the increased inhibitory synapse number observed under this condition (P = 0.0504, unpaired Student’s t-test). Thus, the lack of a corresponding increase in mIPSC frequency despite the increased inhibitory presynaptic density suggests that these additional inhibitory contacts in 5×FAD mice may be immature, silent or otherwise functionally ineffective. Moreover, broader AD-associated dysfunction of PV or other interneuron populations could also contribute to the reduced inhibitory transmission23,24.Although the ERBB4-dependent reduction in mEPSC frequency is consistent with excitatory synapse loss, this synaptic input phenotype alone cannot readily explain the increased FOS activity in excitatory neurons (Extended Data Fig. 6d,f). We therefore examined whether aberrant ERBB4 expression alters the intrinsic neuronal excitability of CA1 pyramidal neurons after Erbb4 modulation. Input resistance was unchanged, but 5×FAD and Erbb4-overexpressing WT pyramidal neurons fired many more action potentials during depolarizing current injection, whereas Erbb4 deletion restored 5×FAD firing to WT levels (Extended Data Fig. 7t–v). These findings indicate that aberrant ERBB4 directly increases intrinsic excitability, providing a mechanism for excitatory hyperactivity. Hyperactivity may then promote glial synapse elimination and subsequent synapse loss, consistent with chemogenetic experiments showing that Gq-driven activation enhances, whereas Gi-driven suppression reduces, synapse phagocytosis (Extended Data Figs. 3 and 7a–i).mTOR mediates aberrant ERBB4 pathologyERBB4 activates several downstream pathways, including the mTOR19,25 and mitogen-activated protein kinase (MAPK) signalling cascades26,27. Notably, neuronal mTOR hyperactivation is associated with seizures, excitatory–inhibitory imbalance, Down syndrome and AD28,29, prompting us to test whether mTOR signalling acts downstream of ERBB4 to mediate AD-related pathological effects. We deleted the gene encoding regulatory-associated protein of mTOR (Rptor), an essential component of the mTOR complex 1 (mTORC1), in CA1 excitatory neurons of 4-month-old 5×FAD mice using CaMKIIα-SaCas9 and sgRptor (Extended Data Fig. 10a). Rptor deletion reduced phosphorylated ribosomal protein S6 (p-S6), confirming suppression of mTORC1 activity (Extended Data Fig. 10b,c). Similar to Erbb4 deletion, Rptor deletion normalized excitatory and inhibitory synapse elimination, restored corresponding synapse numbers, reduced excitatory activity and increased SST activity (Extended Data Fig. 10d–o). Moreover, Rptor deletion significantly attenuated gliosis, reduced both the AXL+ microglia population and amyloid plaque burden (Extended Data Fig. 10p–u). The close correspondence between Rptor and Erbb4 deletion phenotypes placed mTORC1 at a major convergence point linking excitatory neuronal signalling to synaptic, glial and amyloid-related outcomes.We next examined whether excitatory neuronal mTOR signalling is required for the pathological effects induced by ectopic Erbb4 overexpression. To this end, we co-expressed Erbb4 with sgRptor in CA1 excitatory neurons of 2-month-old WT mice (Extended Data Fig. 11a). Despite robust ERBB4 expression, Rptor deletion suppressed p-S6 and prevented excitatory hyperactivity, SST hypoactivity, gliosis, AXL+ microglia, and changes in excitatory and inhibitory synapse numbers (Extended Data Fig. 11b–o). Together, these findings demonstrate that mTOR signalling is a critical downstream mediator of aberrant ERBB4 signalling and is necessary for the induction of multiple AD-like pathophysiological features.Consistent with an ERBB4–mTOR signalling axis, we found that ERENs and excitatory neurons from Erbb4-overexpressing WT mice showed transcriptional changes that resembled those seen in Tsc2-deficient neurons30 (Extended Data Fig. 12a). Notably, these overlapping changes involved genes related to neuronal excitability, including those encoding voltage-gated K+ channels, inwardly rectifying K+ channels, γ-aminobutyric acid type A (GABAA) receptors and GABAB receptors. By contrast, excitatory neurons from Erbb4-deficient 5×FAD mice showed opposing changes in these gene sets (Extended Data Fig. 12a). Given that these ion channels and inhibitory receptors are critical for regulating neuronal excitability31,32,33,34, our findings suggest that aberrant ERBB4–mTOR signalling may promote excitatory neuronal hyperactivity, at least in part, by disrupting transcriptional programs that normally constrain neuronal excitability.
Aberrant excitatory neuronal ERBB4 promotes Alzheimer’s disease pathology - Nature
Neuroinflammation alone may be dispensable for early synapse loss in Alzheimer’s disease.
16,152 words~73 min read