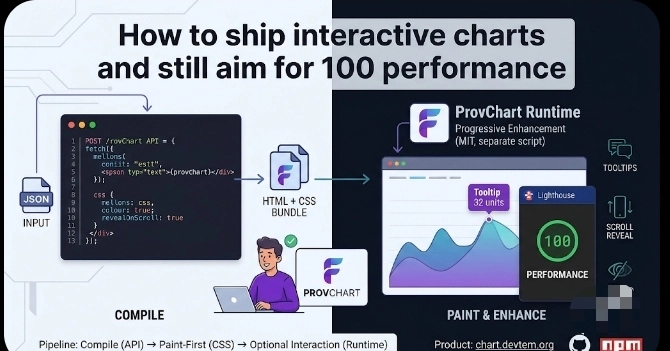
Interactive charts and a perfect Lighthouse run often feel incompatible. The usual path is a 50–150 KB chart library, hydration, and a blank box until JavaScript finishes. You can still offer real visuals and light interaction without paying that tax on every page load.
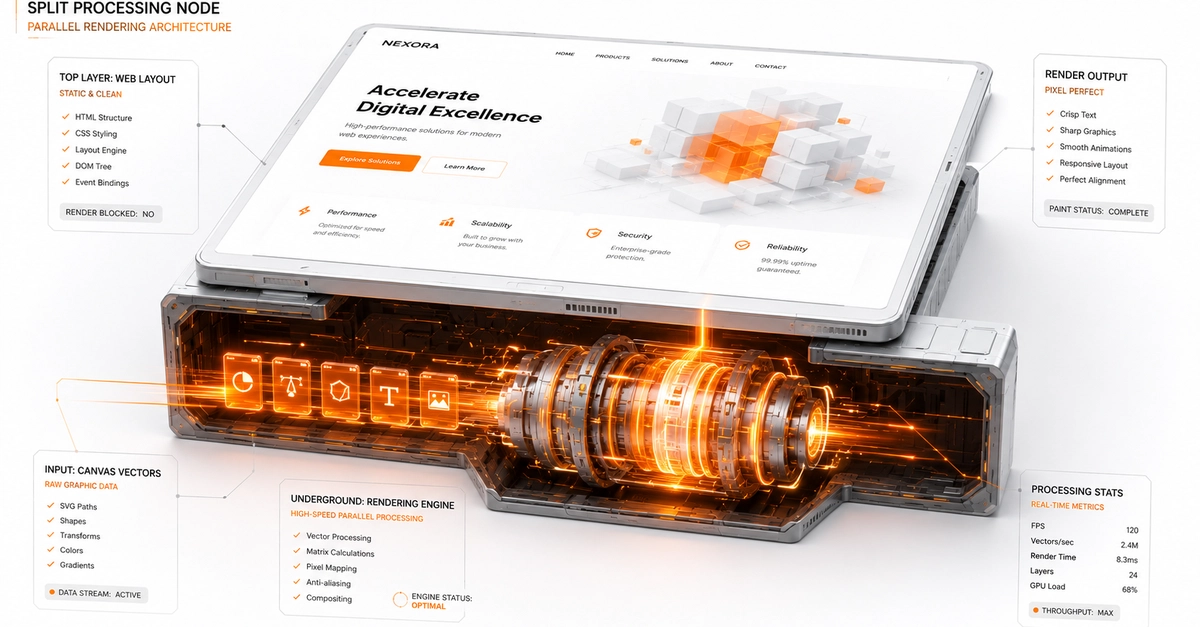
This article is about a paint-first pipeline: compile data to HTML/CSS, let the browser draw on first paint, then add interaction as progressive enhancement.
The real performance problem
Core Web Vitals care about what blocks the main thread and what delays useful pixels.
Cost