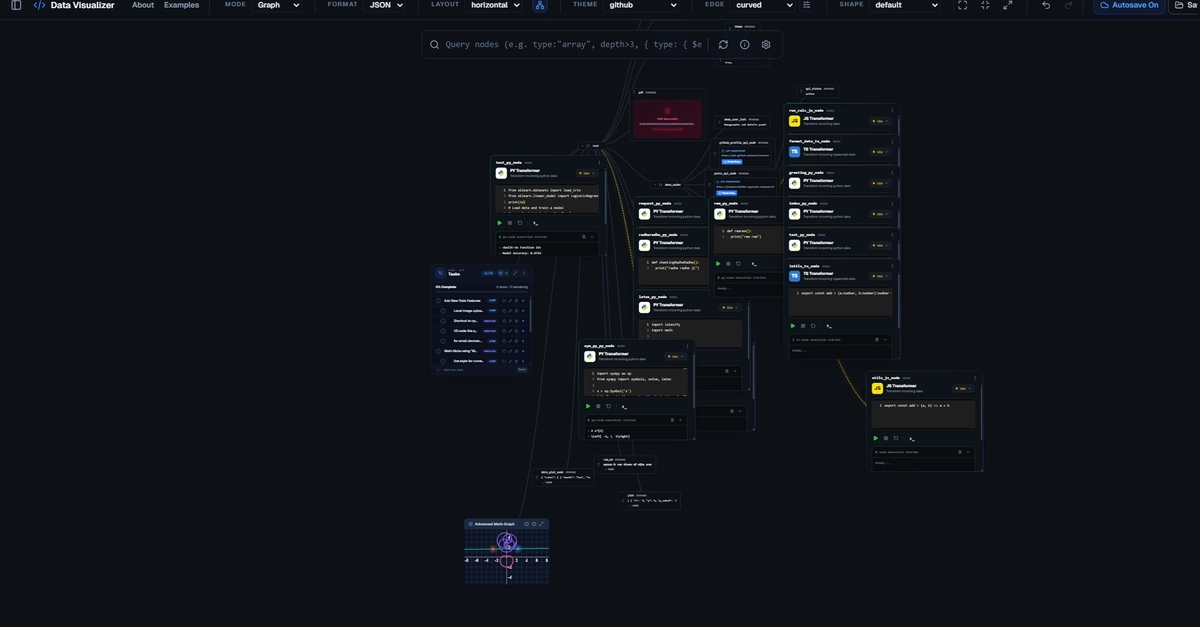
When you build a visual tool for structured data, everything feels instantaneous on toy examples. A 20-line JSON payload renders crisply into an interactive graph with clean nodes, collapsible trees, and smooth connectors.
Then you drop in a real-world file: a 15 MB API response containing nested objects, deep arrays, and hundreds of thousands of key-value pairs.
Suddenly, the browser locks up. The DOM or Canvas scene graph explodes with tens of thousands of objects. Panning drops from 60 fps to single digits, and zooming triggers multi-second layout thrashing.
Here is how I tackled this problem when building the graph visualizer for Treease by separating semantic completeness from visual materialization.
The Core Dilemma: Completeness vs. Canvas Weight