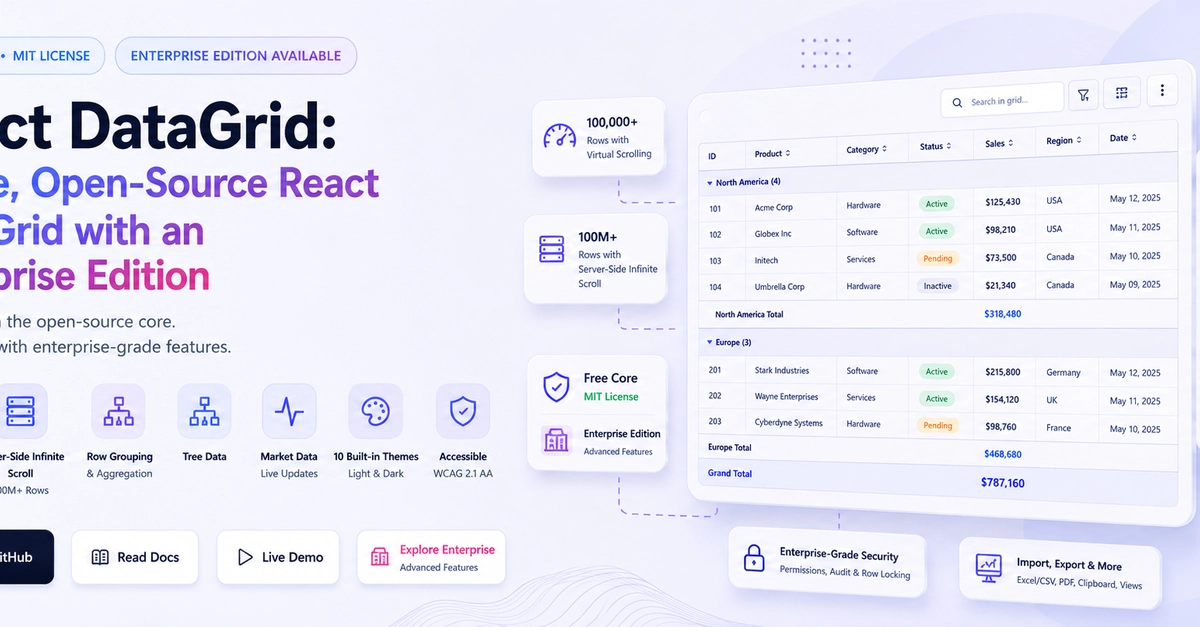
I went through the documentation and feature list of React DataGrid, and I wrote React DataGrid: A Free, Open-Source React Data Grid with an Enterprise Edition (An AG Grid Alternative)
Now I wanted to use it the way I would use any other data grid in a real project: start with a real dataset, build useful interactions around it, push the grid with a large number of records, and see where things get difficult.
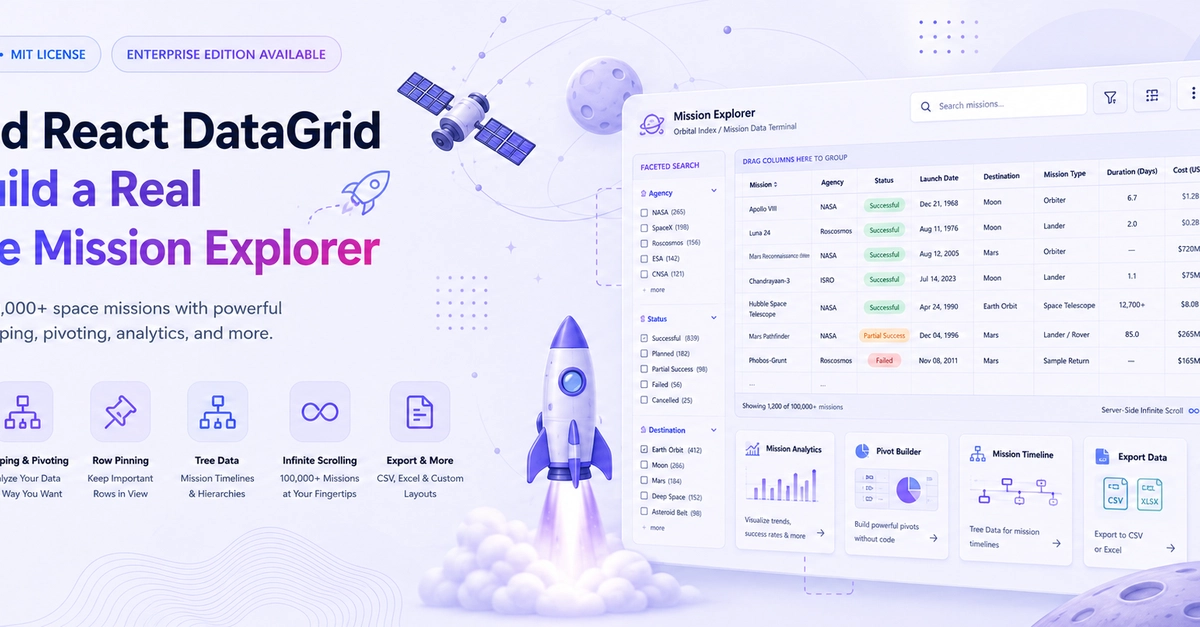
So I built a Space Mission & Satellite Explorer, a small flight-dynamics-style web application for exploring missions across different agencies, destinations, mission types, and decades.
The project works with a 100,000-mission live archive, while a 1,200-row client-side working set powers the interactive analysis experience. That gave me a good opportunity to test much more than basic sorting and pagination, including filtering, faceted search, grouping, pivoting, row pinning, custom cell renderers, virtual scrolling, and server-side infinite scrolling.
I also built two other parts of the application around the same data: a Mission Analytics page for aggregating and visualizing the dataset, and a Mission Details page where I used Tree Data to represent an individual mission's timeline.