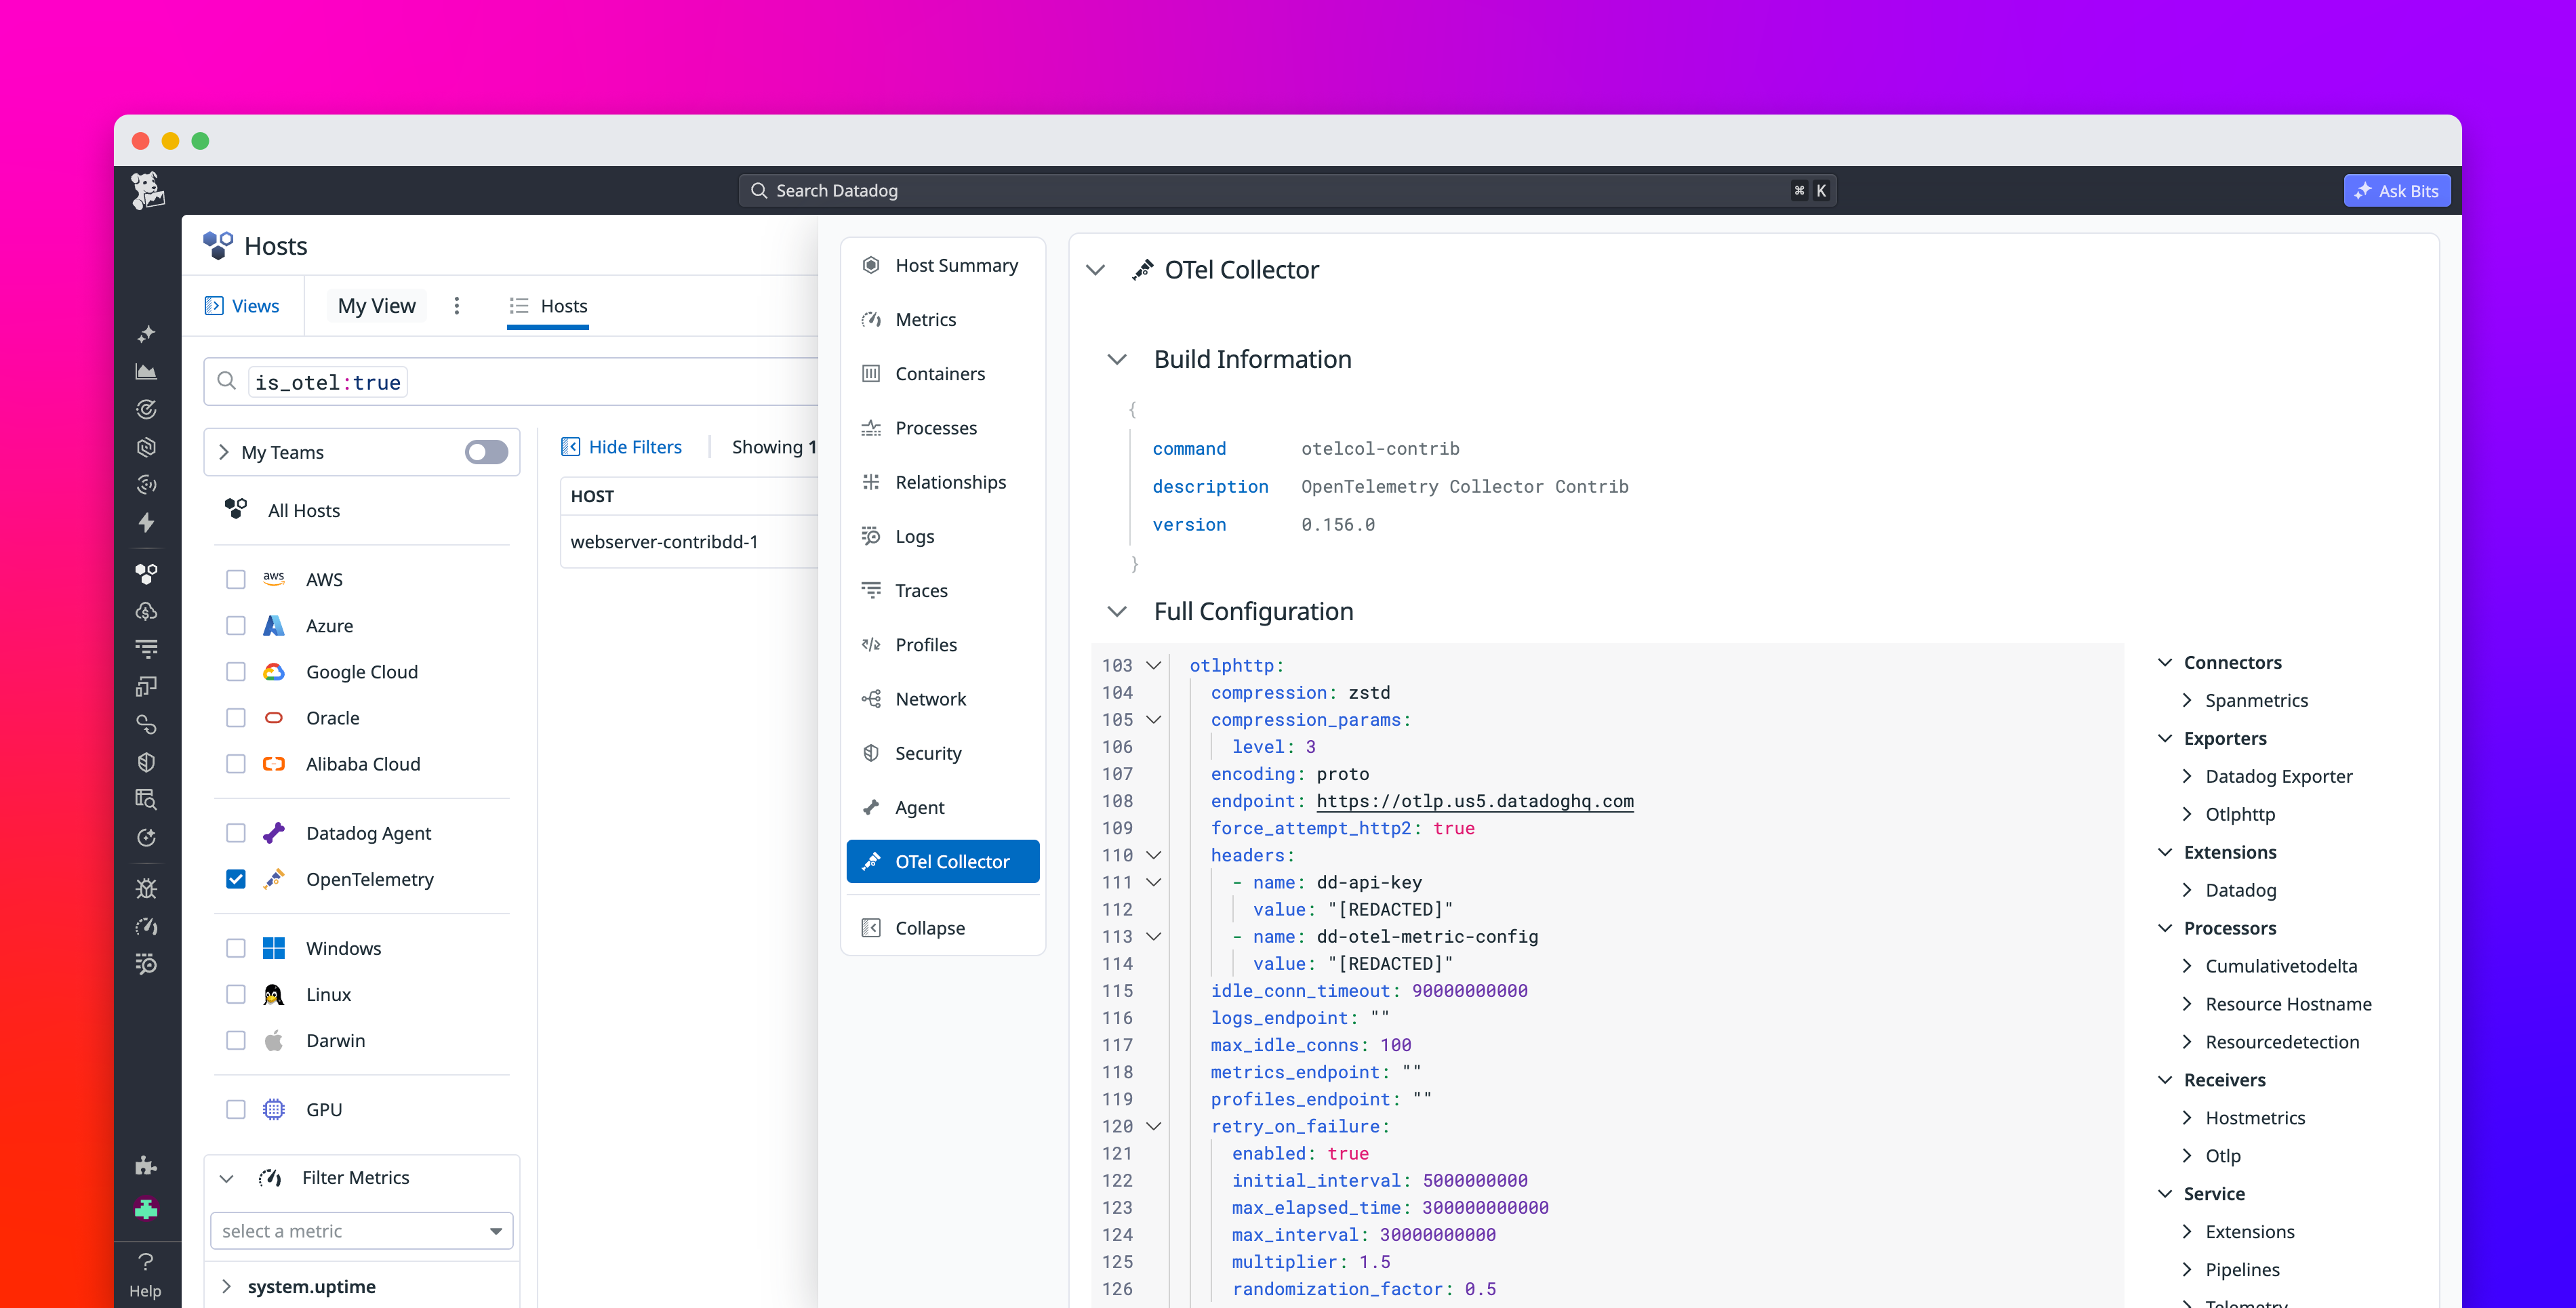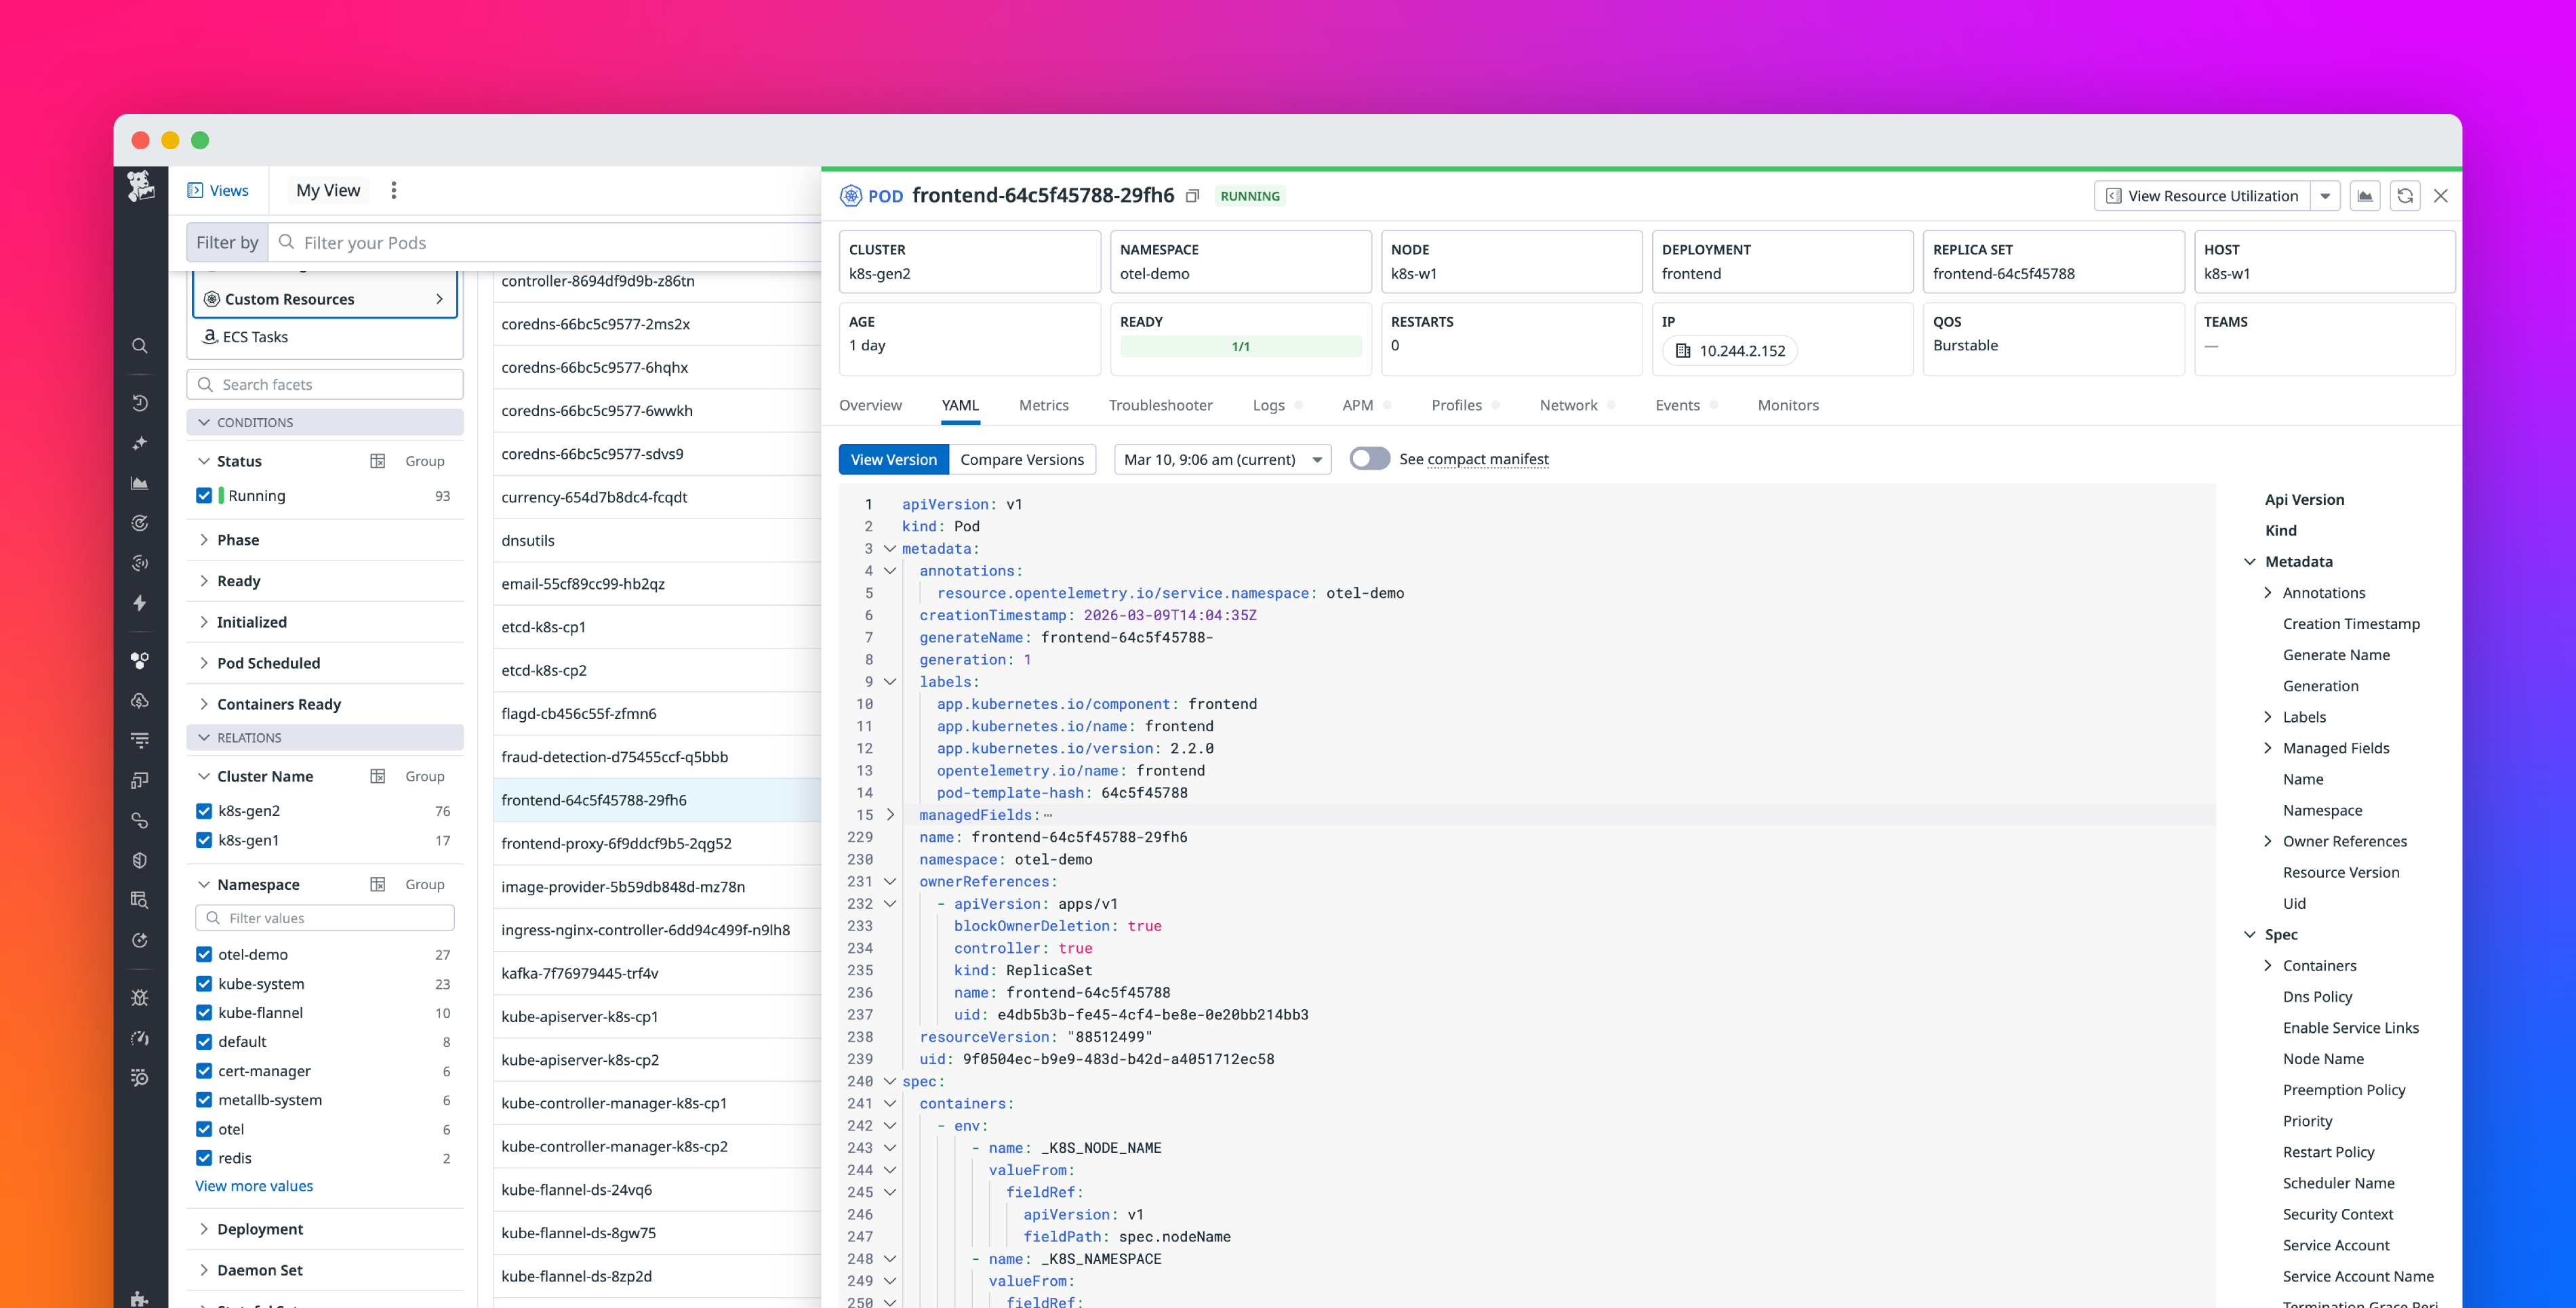
OpenTelemetry (OTel) tail-based sampling helps teams control trace volume by retaining errors, slow requests, and other traces worth investigating while dropping lower-value traffic. In distributed systems, a single request can fan out across many services, each emitting spans. That volume adds up quickly. Some applications produce millions of traces per hour, while large clusters generate more than 10 billion spans per day. Because most of that volume comes from healthy requests that teams are unlikely to investigate, sending every span to an observability backend increases ingest costs, slows queries, and can shorten retention windows.
With tail-based sampling, the OTel Collector waits for a trace to complete before evaluating it against the configured policies. Because Span Metrics are computed before sampling, request, error, and latency data continue to reflect all traffic.
This guide uses a synthetic rideshare application that emits realistic traffic, including intentional errors used to build and validate sampling policies. In this example, the final configuration reduces exported trace volume by about 98% while Span Metrics continue to reflect all traffic.
We’ll cover how to:
Choose between head-based and tail-based samplingDeploy collectors in a gateway pattern that makes accurate tail sampling possibleCompute Span Metrics (RED metrics) on the full trace volume so service health stays accurate as traces dropAdd the tail_sampling processor with a baseline policySample only the traces worth keeping with targeted policiesSolve the developer experience problem tail sampling createsAssemble a production-ready policy stackTune the collector for memory and performance