You can get real distributed traces out of a Node.js service in an afternoon, and you should start with the zero-code auto-instrumentation before you write a single span by hand. The fast path is: install @opentelemetry/sdk-node plus the auto-instrumentations package, point an OTLP exporter at a collector or a backend, and launch your app with one extra --require flag. Custom spans come later, only where the automatic ones leave gaps.
That order matters. Most teams I've watched adopt OpenTelemetry (OTel) burn their first day hand-writing spans around functions that the auto-instrumentation would have covered for free. Below is the sequence that actually fits in an afternoon, with the tradeoffs I ran into.
What does OpenTelemetry actually give you?
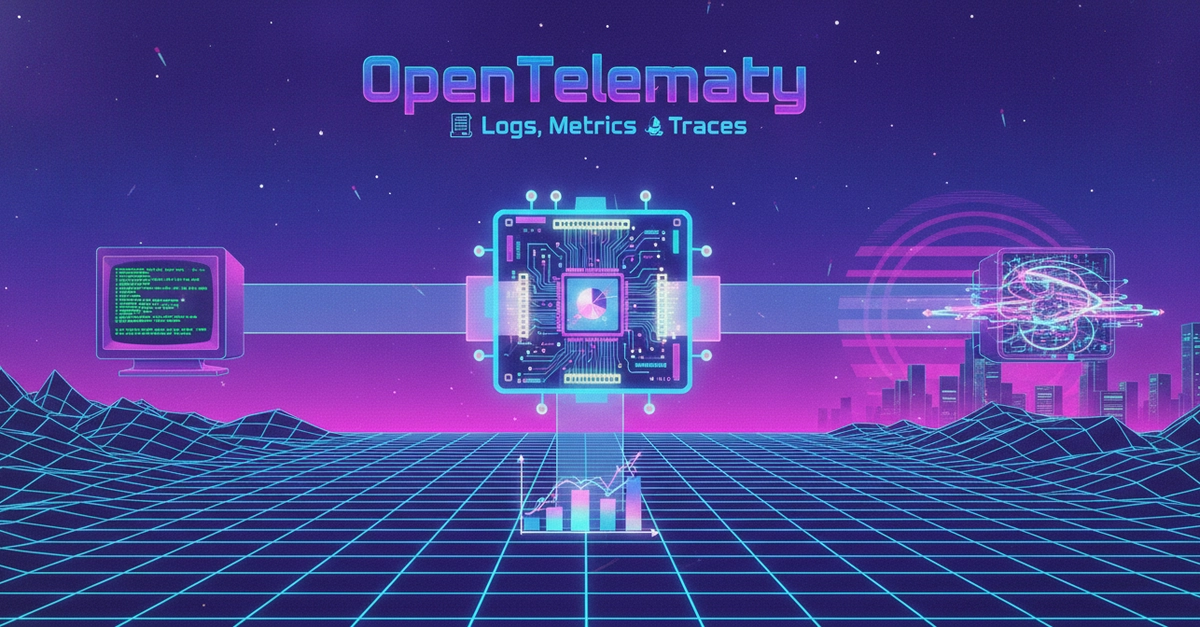
OpenTelemetry is a vendor-neutral standard for generating telemetry — traces, metrics, and logs — plus SDKs that produce it and a wire format (OTLP) for shipping it. The value is that your instrumentation isn't tied to one observability vendor. You emit OTLP, and whatever speaks OTLP on the other end (an open-source collector, Jaeger, Grafana Tempo, or a commercial backend) can ingest it.
For a first pass, focus on traces. A trace is a tree of spans showing one request as it moves through your code: the incoming HTTP handler, the database query it triggered, the outbound API call it made. That's the signal that answers "why was this request slow?" — the question that usually drives adoption in the first place.