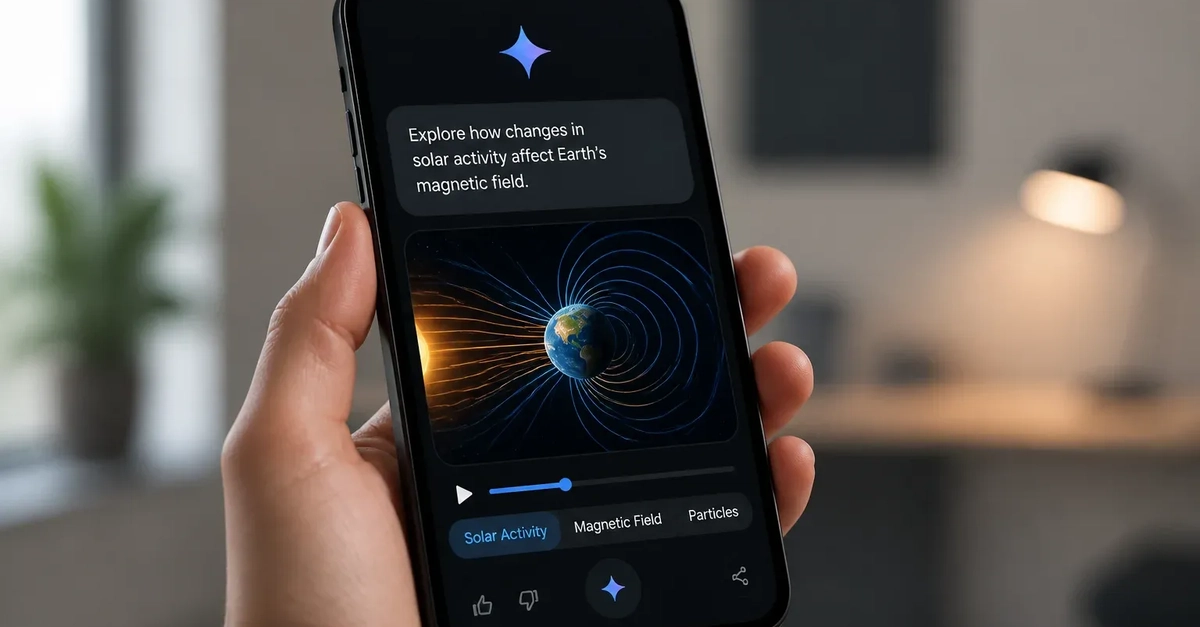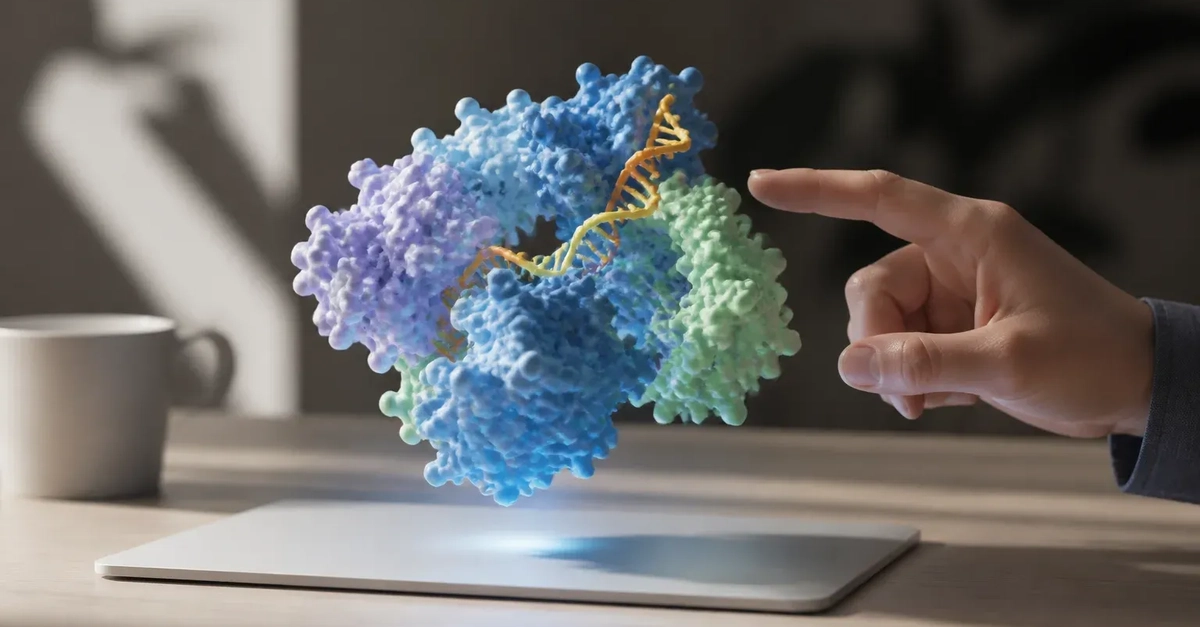
Google has introduced interactive 3D visualizations and charts inside the Gemini app, allowing users to explore custom models directly within a chat instead of receiving only text or static images. The feature can turn prompts into manipulable visual explanations, such as a rotating molecule, a fractal, or a simulation of the Moon orbiting Earth. For users working with scientific, technical, and conceptual material, the change moves Gemini closer to an interactive exploration interface.
According to Google's official announcement on Gemini 3D models and charts, users can begin prompts with phrases such as “show me” or “help me visualize,” then interact with the resulting output. Google describes controls that can include sliders for changing variables, making the experience more than a generated illustration.
The rollout is global for Gemini app users, but Google says the capability is not yet available for Education and Workspace accounts. Access is also tied to selecting the Pro model at gemini.google.com. That distinction matters for organizations assessing whether the feature can be incorporated into managed workplace or education environments today.
What Gemini's interactive visualizations add