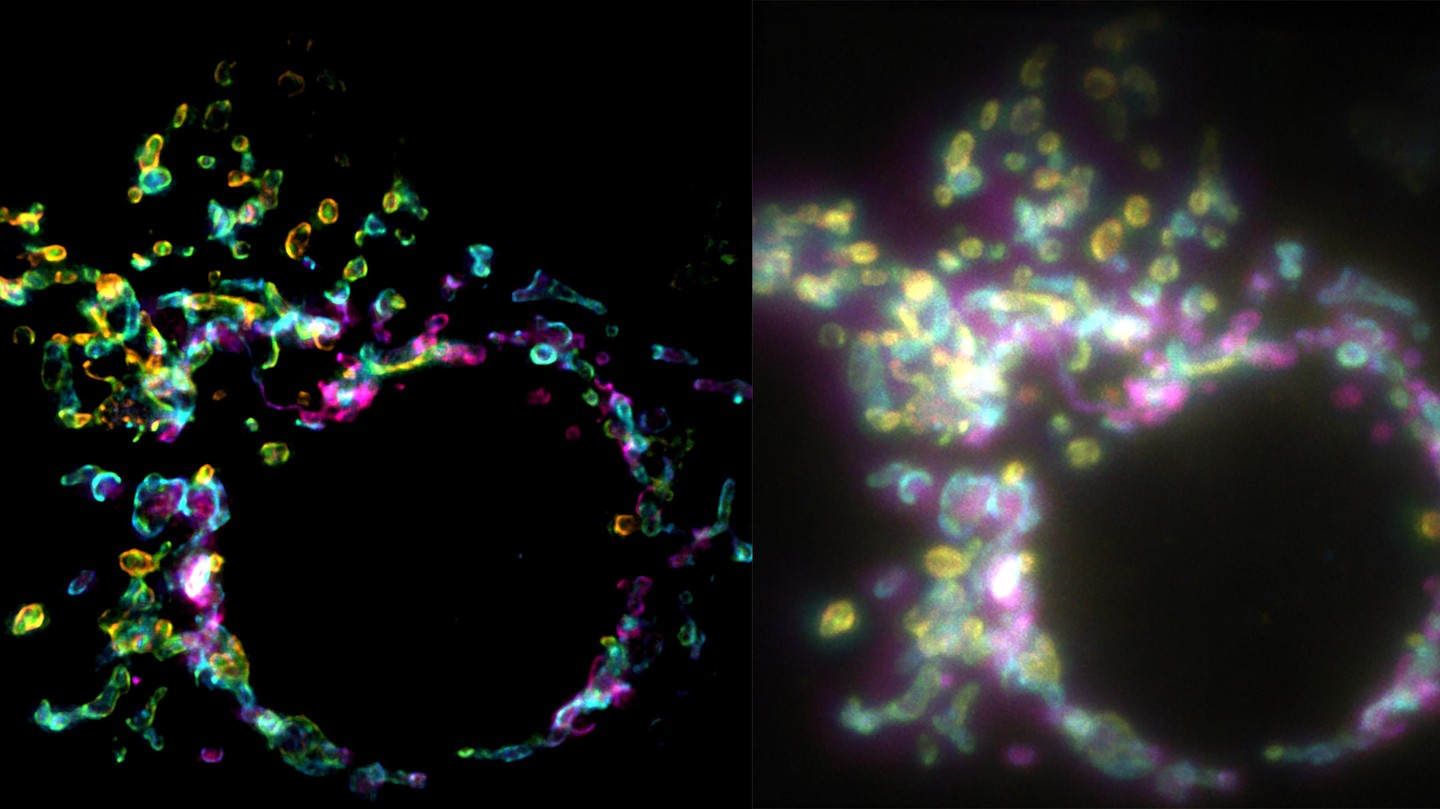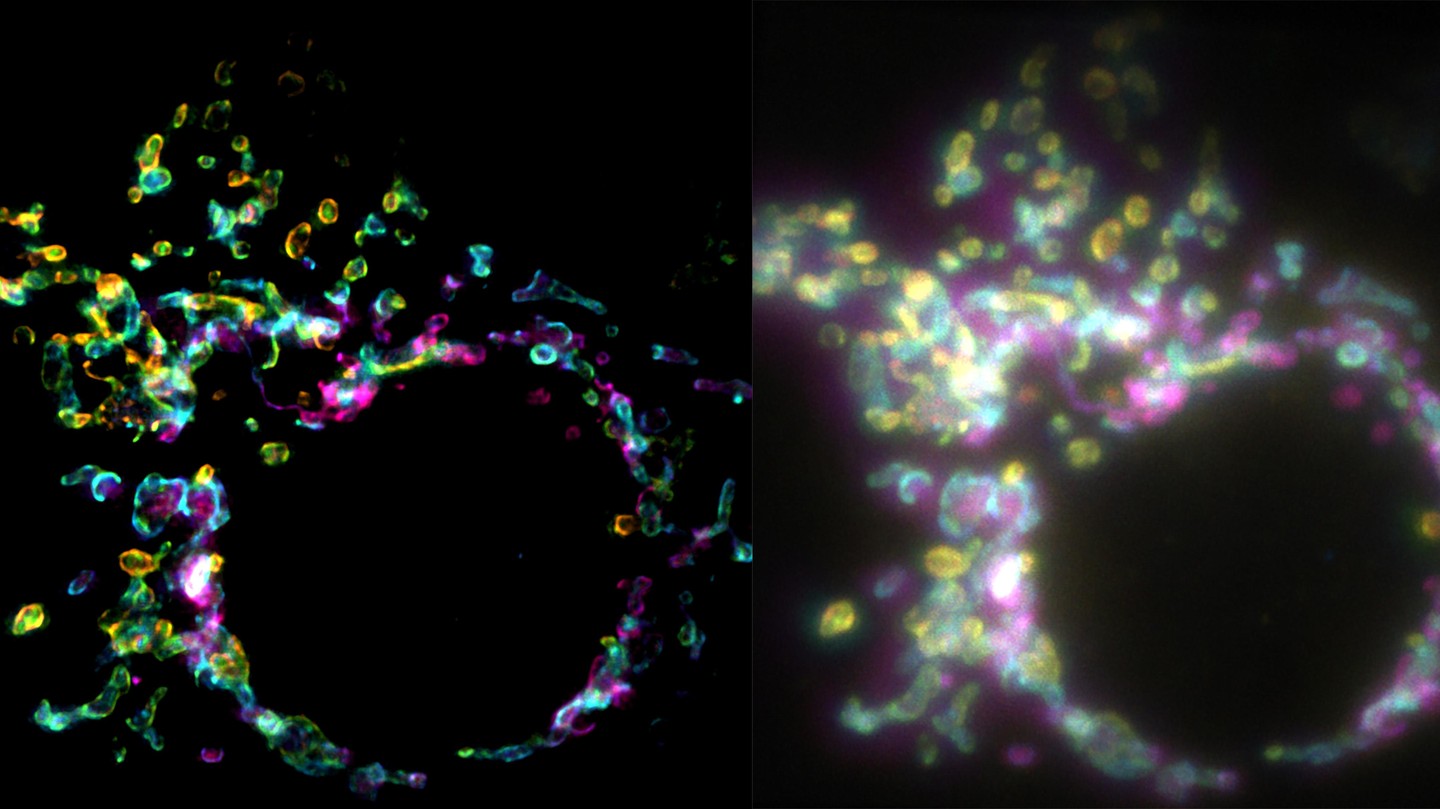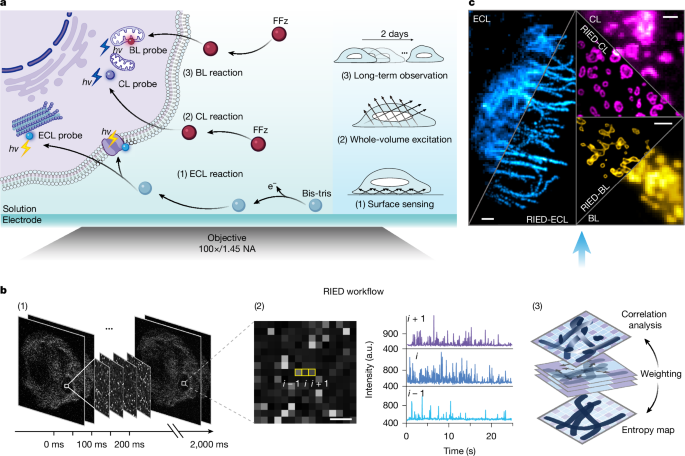
MainReaction-enabled imaging is based on specifically designed luminescence chemistry, which can be tailored for different applications (Fig. 1a). Specifically, ECL is triggered and controlled by electrochemical reactions, imparting high surface sensitivity, which inherently facilitates imaging of objects near the electrode. CL relies on the reactant diffusion in solution, enabling homogeneous excitation throughout the imaging volume. BL makes use of enzymatic reactions to produce catalytic luminescence in living organisms, providing excellent biocompatibility for live-cell imaging. Despite these advantages, so far, the reaction-based luminescence suffers from low photon output, usually requiring prolonged exposure times by tens of seconds to accumulate a single image10,11, which inevitably overlooks the spatiotemporal information. As a result, unlike established super-resolution fluorescence microscopy, achieving super resolution using reaction-enabled luminescence remains challenging.Fig. 1: RIED concept.a, Schematic of luminescent-reaction-based imaging—ECL, CL, BL and their features. b, Workflow of RIED reconstruction: (1) spatiotemporal acquisition of luminescent signals; (2) zoomed photon-signal distribution for a single frame in (1) and corresponding intensity profiles of three separate pixels highlighted by yellow boxes; (3) schematic of the core reconstruction principle used in RIED. Spatiotemporal correlation and entropy maps are calculated and weighted for super resolution. c, Representative super-resolution ECL, CL and BL images of intracellular organelles before and after RIED reconstruction. Scale bars, 3 µm. a.u., arbitrary units.Source dataFrom a fundamental perspective, the reaction-based luminescence is a highly dynamic process, intrinsically initiated by individual reactions. To achieve super-resolution imaging, we propose to experimentally monitor these reaction-based luminescence processes in an image sequence through a spatiotemporal isolation strategy. This enables the extraction of distinct reaction-driven photon statistics for super-resolution reconstruction using a tailored workflow (Fig. 1b, Extended Data Fig. 1 and Supplementary Video 1). Spatiotemporal recordings uncover unique luminescence profiles of zero-light excitation background, high signal-to-noise ratio and high-contrast fluctuations between the emitting reaction sites and the dark background (Extended Data Fig. 2 and Supplementary Figs. 1 and 2). Accordingly, we performed spatiotemporal cross-correlation analysis on sequences of photon events excluding pixels dominated by overlapping emitters and narrowing the point spread function (PSF) width, drawing on recent fluctuation-based super-resolution fluorescence methods12,13,14. To further mitigate discontinuities from ECL heterogeneity, we introduced a spatial entropy map before the correlation analysis, quantifying the local information content and refining the correlation cumulant. Finally, a subsequent deconvolution was applied to sharpen the spatial resolution and the image contrast under low-photon-budget conditions (Extended Data Fig. 3).To validate this workflow, we implemented simulated data to confirm that reaction-driven photon statistics can provide effective fluctuations for resolution enhancement, which shows genuine reconstruction of the ground-truth structures (Extended Data Fig. 4). Further, we introduced Fourier ring correlation (FRC) resolution15, resolution-scaled error (RSE) and resolution-scaled Pearson coefficient (RSP) metrics16 for step-by-step evaluations (Extended Data Fig. 3). These results indicate that RIED reconstruction effectively improves image resolution while introducing limited artefacts. Moreover, as RIED is tailored to reaction-based luminescence processes, it demonstrates improved reconstruction performance compared with conventional super-resolution methods12,13,14,17 originally developed for fluorescence sequences (Extended Data Fig. 5). Overall, our optimized pipeline yields the reaction-driven super-resolution images, as exemplified in Fig. 1c.Super-resolution ECL imagingWe first evaluated the performance of RIED in ECL imaging. In conventional ECL imaging, efforts to improve the performance of ECL-based cell imaging have focused on increasing the photon emission by engineering amplified probe systems or extending the imaging time18. Nevertheless, these strategies entail limitations in effective labelling and imaging resolution. As such, conventional ECL microscopy only provides extracellular, whole-cell or obscure subcellular information19,20. So far, efficient ECL imaging of intracellular organelles has not been demonstrated, imposing a fundamental barrier to super-resolution imaging (Supplementary Note 1).To address this issue, we developed a high-efficiency ECL cell imaging system (Fig. 2a). Ru(bpy)32+ molecules were anchored to the antibody as the luminescent probe, which exhibits excellent binding specificity and can efficiently label cellular structures with high coverage by means of immunolabelling. Bis(2-hydroxyethyl)amino-tris(hydroxymethyl)methane (Bis-tris), a known co-reactant in ECL21,22, was chosen here to replace commonly used tripropylamine (TPrA) for ECL cell imaging. We found that Bis-tris improved the ECL cell imaging brightness by about 1,000-fold under optimized imaging conditions (Fig. 2b,c and Supplementary Fig. 3), allowing imaging of microtubules23. This improvement is attributed to the intrinsic long lifetime and the extended diffusion distance of Bis-tris radical22, which increases the probability of its encountering and reacting with Ru(bpy)32+-labelled organelles.Fig. 2: Performance of RIED in ECL.a, Schematic of the ECL imaging set-up. b, Conventional ECL images of microtubule filaments with TPrA and Bis-tris (100 mM). Scale bar, 10 µm. EM gain: 500, exposure time: 15 s. Experiments with consistent results were repeated independently ten times. c, Intensity profiles of images in b. d, Microtubule filaments in a HeLa cell imaged by conventional ECL (top left), RIED-ECL (right) and SACD-FL (fluorescence, bottom left). Scale bar, 5 µm. e, Zoomed views from the white box in d. Scale bar, 500 nm. f, FRC analysis of the conventional ECL, RIED-ECL and SACD-FL images in d. g, Intensity profiles and multiple Gaussian fitting of the RIED-ECL and SACD-FL reconstructed microtubule filaments indicated by the white arrows in e. h, RIED images of microtubule filaments in a HeLa cell reconstructed with 100 frames and 800 frames (exposure time: 20 ms). Scale bar, 500 nm. Experiments with consistent results were repeated five times. i,j, Structural similarity (SSIM) (i) and FRC analysis (j) of images reconstructed with different frames. The results are obtained from ten technical reduplicates in a representative sample for qualitative comparison. Error bars represent mean ± s.d. k, 3D distributions of microtubules in a HeLa cell with RIED-ECL and the y–z cross-sections along the dashed white line. Scale bar, 5 µm. l, Zoomed y–z cross-section along the solid yellow box in k. Scale bar, 500 nm. m, Lateral view of microtubules marked with the dashed yellow box in k and its double-peak Gaussian fitting indicated by the white arrows. Scale bar, 500 nm. n, RIED-ECL for high-throughput super-resolution imaging and zoomed microtubules in a HeLa cell. Scale bars, 40 µm (main); 5 µm (zoomed image). o, rFRC mapping of the microtubules in n. p, Distribution of rFRC resolution in o. a.u., arbitrary units.Source dataWith this profoundly enhanced ECL performance, microtubule filaments can be clearly visualized even under 20-ms exposure time (Supplementary Video 2). Implementation of RIED in ECL further allows visualization of intracellular organelle structures at the sub-diffraction scale. For cross-validation, we compared the reconstructed RIED results with the fluctuation-based fluorescence super-resolution imaging using autocorrelation with two-step deconvolution (SACD)12 because both methods can target the same microtubules and their corresponding images exhibit a high consistency (Fig. 2d,e). Imaging of other targets, such as mitochondria and integrins, further demonstrates the applicability of RIED-ECL for intracellular imaging (Supplementary Fig. 4). A quantitative FRC resolution evaluation reveals a substantial improvement in the spatial resolution of ECL, reaching 97 nm (ref. 24) (Fig. 2f). The peak-to-peak separation of the intertwining microtubule filaments suggests that the resolving power of RIED is comparable with that of fluorescence SACD (Fig. 2g). Although improving spatial resolution typically requires prolonged imaging time, RIED can efficiently use individual ECL photons to generate a super-resolution image from just 100 raw frames at 20-ms exposure time (Fig. 2h). The imaging quality is confirmed by the structure similarity index measure (SSIM > 0.9) (Fig. 2i) and FRC analysis (<110 nm) (Fig. 2j), demonstrating high spatiotemporal resolution in ECL imaging (Supplementary Figs. 5–7 and Methods). We noted that, in some RIED-ECL images, microtubules seem discontinuous. This feature was also observed in the corresponding summed raw ECL data and fluorescence super-resolution images (Extended Data Fig. 6), which probably reflect the underlying probe distributions associated with the chemical fixation25 and the characteristics of the electrochemical excitation (Supplementary Fig. 8 and Supplementary Note 2).So far, 3D ECL microscopy remains a technical challenge, mainly because of the difficulty in regulating the excitation depth. In our experiments, we observed that the ECL emission depth increases with increasing voltage, reflecting enhanced generation of reactive radicals (Bis-tris•). Nevertheless, higher voltages also accelerate radical consumption and quenching, which can reduce the effective ECL signals. Accordingly, we used stepped voltage application, using a lower voltage (1.0 V) to image regions near the electrode surface and gradually increasing the voltage to 1.8 V to access deeper layers (Extended Data Fig. 7). By synchronizing voltage control with imaging focal plane changes (Methods, Supplementary Fig. 9 and Supplementary Note 3), a 3D-RIED image was built that clearly distinguishes the cytoskeleton network in all dimensions (Fig. 2k, Extended Data Fig. 7 and Supplementary Video 3). Notably, microtubules spaced by 235 nm in the axial distance and 116 nm in the lateral plane can be resolved with 3D-RIED (Fig. 2l,m and Supplementary Fig. 9), comparable with the 3D fluorescence super-resolution imaging12.An extra benefit from the high spatiotemporal resolution of RIED is high-throughput imaging. Microtubules on a large scale (0.53 × 0.53 mm2) area with 3 × 3 fields of view (FOVs) (Fig. 2n and Supplementary Fig. 10) were imaged (Supplementary Video 4) with a mean rolling Fourier ring correlation (rFRC) resolution24 of 153 nm (Fig. 2o,p). Together, we demonstrated the first high spatiotemporal, 3D and high-throughput super-resolution cell imaging using RIED-ECL.Highly sensitive imagingBecause the reaction is triggered at the electrode surface10 and no excitation light is introduced, ECL inherently offers high surface sensitivity (Supplementary Note 4). RIED-ECL allows for the distinct observation of microtubule filaments near the electrode (Fig. 3a), as further evidenced by curvature analysis (Fig. 3b). We analysed the curvature and orientation of microtubule filaments across different mitotic phases (Extended Data Fig. 8). Notably, at the same mitosis stage, the RIED results exhibit smaller curvature values and reveal more concentrated orientation distributions compared with the fluorescence super-resolution results. This difference can be attributed to the high surface sensitivity of ECL, which mainly accounts for more linear microtubules near the surface.Fig. 3: Surface-sensitive imaging using RIED-ECL.a, Microtubule filaments in a COS-7 cell imaged by RIED-ECL (green), SACD-FL (blue) and their zoomed views. Scale bars, 5 µm (main); 500 nm (zoomed image). b, Curvature distributions of microtubule filaments in a. c, Merged super-resolution images of CEA in MCF-7 cells by RIED-ECL and SACD-FL. Scale bar, 5 µm. d, Zoomed views of detected CEA spots in c. Scale bar, 1 µm. e, Illustration of CEA spot detection and its detection threshold, calculated as the detection baseline plus three times the standard deviation of the background noise. Intensity is normalized. Consistent results were validated across ten independent experiments. a.u., arbitrary units.Source dataOwing to its high sensitivity, ECL has been an established tool in ultrasensitive bioassay7. Building on this strength, the super-resolution ECL implementation further enables ultrasensitive single-cell biomarker imaging. We evaluated the sensitivity of RIED-ECL, defined as the detection threshold for imaging a biomarker, carcinoembryonic antigen (CEA), and compared it with results from fluorescence SACD (Fig. 3c,d and Supplementary Fig. 11). Despite the lower efficiency of ECL, quantitative analysis reveals an eightfold reduction in the detection threshold for investigating CEA using RIED-ECL than fluorescence SACD (Fig. 3e), aided by the elimination of autofluorescence in ECL. These results highlight the superior sensitivity of RIED-ECL and its ability to provide complementary insights to fluorescence super-resolution microscopy.Super-resolution CL and BL imagingGiven the basic principle of RIED, this chemical microscopy concept is universally applicable to other reaction-based luminescence imaging systems, including CL and BL—a subtype of CL occurring in live organisms. CL and BL only require standard biochemistry for intracellular imaging, obviating the need for electrochemical set-up in ECL (Fig. 4a). Different from conventional optical microscopy relying on light for illumination, RIED manipulates the imaging characteristics by tuning luminescence chemistry, allowing direct adaptations to diverse applications.Fig. 4: RIED-enabled super-resolution CL and BL imaging.a, Illustration of the CL/BL imaging set-up. The zoomed region represents the key step in BRET: the enzymatic reaction between a substrate and NanoLuc luciferase. Protein structures were obtained from the Protein Data Bank (PDB IDs: 5B0U and 8BO9). Molecular graphics were prepared using PyMOL (Schrödinger, LLC). b, 3D distributions of mitochondria imaged by conventional CL and RIED-CL. Scale bar, 5 µm. c, Magnified 3D rendering of the boxed region in b recorded by RIED-CL. Scale bar, 2 µm. c1, Zoomed y–z cross-sections along the yellow box in c imaged by conventional CL (top) and RIED-CL (bottom). The yellow arrows indicate the positions at which the intensity profiles are taken and the distances between peaks are obtained using multiple Gaussian fitting. Scale bar, 500 nm. d, Correlation of 2D views of c imaged by RIED-CL and SACD-FL. Scale bar, 2 µm. e, Intensity profiles and multiple Gaussian fitting of the RIED-CL and SACD-FL reconstructed mitochondria indicated by the yellow arrows in d. f–h, RIED-BL images and corresponding SACD-FL images of microfilaments (f), endoplasmic reticulum (g) and microtubules (h). Scale bars, 5 µm (main); 2 µm (zoomed images). i, Mitochondrial imaging result comparison between SIM-FL (18 min) and RIED-BL (160 min). Scale bars, 3 µm (main); 1 µm (zoomed images). Experimental comparisons with consistent results were repeated independently ten times. j, Effective super-resolution reconstruction comparison of detectable areas of mitochondria between SIM-FL and RIED-BL. The mean area of mitochondria from different fields of view at the initial imaging time point (0 h) is normalized to 1. n for the technical replicates is 10. Error bars represent mean ± s.d. k,l, Normalized intensity (k) and imaging contrast (l) against time comparison between RIED-BL and SIM-FL. The shaded areas represent mean ± s.d. per 0.5 h (n = 180) for BL analysis and per 15 s (n = 150) for SIM. a.u., arbitrary units.Source dataFor the RIED-CL demonstration, we used a bioluminescence resonance energy transfer (BRET)-based enzyme catalysis system, green-enhanced nano-lantern (GeNL)26, in which NanoLuc luciferase acts as the donor, mNeonGreen fluorescent protein functions as the acceptor and fluorofurimazine (FFz) serves as the substrate for imaging mitochondria in fixed COS-7 cells. Taking advantage of the uniform volume excitation in CL, RIED-CL realizes 3D mapping of the mitochondrial distribution with a step-scanning configuration (Fig. 4b and Methods), achieving lateral and axial resolutions of 102 nm and 221 nm, respectively (Fig. 4c–e and Supplementary Fig. 12). The reconstructed results were further confirmed by correlated imaging with the fluorescence SACD (Fig. 4d,e and Extended Data Fig. 9).After benchmarking RIED-CL in fixed cells, we then transformed the same enzyme-based luminescence chemistry into live cells for BL demonstration. Using BL in live COS-7 cells, we explored the broad applicability of RIED for imaging a variety of intracellular organelles, including microfilaments (Fig. 4f), endoplasmic reticulum (Fig. 4g) and microtubules (Fig. 4h). Their reconstructed results are comparable with the fluorescence super-resolution images. Notably, RIED-BL achieves a spatial resolution of 117 nm, far surpassing conventional diffraction-limited BL imaging (Supplementary Fig. 13), demonstrating the versatility of RIED for super-resolution BL imaging.Notably, by eliminating laser-induced phototoxicity and photobleaching, BL offers excellent biocompatibility, facilitating continuous super-resolution imaging of live cells while supporting cellular viability over extended periods under the reaction imaging conditions (Supplementary Figs. 14 and 15 and Supplementary Note 5). We compared RIED-BL with a live-cell super-resolution fluorescence technique—structured illumination microscopy (SIM)17. Under continuous laser illumination, SIM rapidly shows severe photobleaching for live-cell imaging within 18 min (Methods). On the other hand, RIED-BL maintains a stable luminescence state over the same period and even lasts for hours (Fig. 4i). Moreover, BL prevents photodamage, preserving the imaging area of mitochondria, whereas fluorescence imaging exhibits a marked loss of detectable structures over time (Fig. 4j). Taking advantage of this intrinsic stability, RIED-BL permits continuous ultralong-term live-cell imaging for 41 h, with a stable luminescence intensity and imaging contrast (Fig. 4k,l and Supplementary Video 5). Collectively, the extension to CL and BL emphasizes luminescent-reaction-enabled super-resolution microscopy as a light-excitation-free imaging modality offering chemistry-designed 3D capacity and long-term live-cell compatibility.Tracking continuous live-cell dynamicsNext we applied RIED-BL for long-term observation of live-cell dynamics, enabling direct observation of fission and fusion of individual mitochondria (Extended Data Fig. 10) and their network dynamics. At an imaging resolution of 104 nm, we continuously monitored mitochondrial motions in live COS-7 cells (Fig. 5a, Supplementary Fig. 16 and Supplementary Video 5). Within a 55 × 55-µm2 FOV, individual mitochondria were quantitatively analysed to obtain their mean velocity, diameter and counts over time (Fig. 5b). The analysis reveals faster movement near the cell periphery and slower motion in the perinuclear region, with velocity fluctuations in an hourly timescale at the perinuclear zone (Fig. 5a). We also found that, during the continuous observation, the number of mitochondria decreases after about 25 h, whereas the mean diameter begins to increase (Fig. 5b), probably reflecting the hallmarks of the apoptotic process27.Fig. 5: Observation of mitochondrial dynamics using RIED-BL.a, Mitochondrial motion trajectories and corresponding velocity analysis within 41 h. Scale bars, 5 µm (main), 2 µm (zoomed images). b, Quantification of mitochondrial motion profiles (counts, velocity and diameter). The shaded areas represent mean ± s.d. per 0.5 h (n = 180). c, Large FOV monitoring of mitochondrial transfer. Scale bar, 10 µm. d, Two representative mitochondrial transfer events by motion velocity, direction and MSD analysis. Scale bars, 2 µm. e, Statistical classification of two distinct mitochondrial transfer types. f,g, ‘Direct motion’ (f) and ‘indirect motion’ (g) snapshots of the cells in c and corresponding mitochondrial transfer trajectories. Scale bars, 2 µm. All of the recorded trajectories encompass the entire mitochondrial transfer event, including movement both before and after the transfer process. a.u., arbitrary units.Source dataMitochondrial transfer is increasingly recognized as an important mechanism in intercellular communication, cellular repair and tumour microenvironment modulation28,29. Using techniques such as flow cytometry, electron microscopy and fluorescence imaging30,31,32, three transfer pathways, including tunnelling nanotubes, extracellular vesicles and free release/capture, have been identified33. However, resolving the transfer dynamics at the single-mitochondrion level remains elusive. Here we tracked individual mitochondrial trajectories using RIED-BL. This enabled the continuous, ultralong-term super-resolution observation of mitochondrial behaviour beyond the constraints of conventional imaging windows (Fig. 5c and Supplementary Video 6). Our analyses reveal two distinct transfer modes: the direct motion and the indirect motion (Fig. 5d,e and Supplementary Fig. 17). The direct motion is characterized by relatively straight trajectories (Fig. 5f) and higher, more uniform velocities with average diffusion exponent of mean square displacement, MSD(α), of 1.34 (Methods). By contrast, the indirect mode exhibits a multiphase process, including initial steady movement, transient stalling and subsequent directed motion towards the recipient cell, accompanied by more variable trajectories (Fig. 5g) and heterogeneous velocities with average MSD(α) of 0.96. These observations offer a quantitative, whole-process view of mitochondrial transfer dynamics at the single-organelle level in live cells.DiscussionIn summary, we have presented a chemistry-enabled imaging methodology, RIED, which achieves 3D super-resolution ECL, CL and BL intracellular imaging, matching the resolution of state-of-the-art live-cell fluorescence super-resolution microscopy while providing unique chemical-excitation-defined advantages.Across the diverse classes of super-resolution fluorescence microscopy, there exists a fundamental trade-off in their spatiotemporal resolution, excitation depth, FOV, imaging duration and phototoxicity—a critical constraint for live-cell imaging34 (Supplementary Table 1). On one hand, ultrahigh-resolution fluorescence techniques35,36,37,38,39 offer sub-nanometre localization precision but are typically limited in imaging speed or FOV, making them suitable for resolving local molecular organizations. On the other hand, live-cell fluorescence methods12,13,14,17 enable rapid, low-phototoxicity super-resolution imaging over large FOVs but are often limited to moderate spatial resolution. Distinct from these fluorescent methods, RIED relies on reaction excitation and benefits from an intrinsic zero-light excitation background regime for high sensitivity, which shows a balanced spatial/temporal resolution, a large FOV and an ultralong-term continuous live-cell observation merit.Looking forward, reaction-enabled super-resolution microscopy marks a transition from optically controlled excitation physics to reaction-tailored luminescence chemistry, enabling the design of new imaging opportunities. As the image contrast in reaction-enabled microscopy is driven by chemical reactivity, this chemical microscopy intrinsically visualizes the activity of the molecule rather than just molecular positions (Supplementary Fig. 18). Future coupling of this unique mechanism to native biochemical reactions may provide a further activity view into functional imaging analysis. Therefore, we anticipate that the development of RIED will highlight a chemistry-based super-resolution imaging methodology, shining a unique, reaction-driven light on biological processes.MethodsLabelling the cellular structures with ECL probesPreparation of Ru(bpy)3
Luminescent-reaction-enabled super-resolution imaging - Nature
A new chemistry-based super-resolution imaging framework is described, enabling 3D, laser-free, highly sensitive and ultralong-term imaging of live cells which overcomes the limitations in spatiotemporal resolution associated with reaction-based imaging methods.
10,355 words~47 min read