Most retail investors track their portfolio in a spreadsheet.
Some upgrade to a free app that shows total value and daily change. That's it.
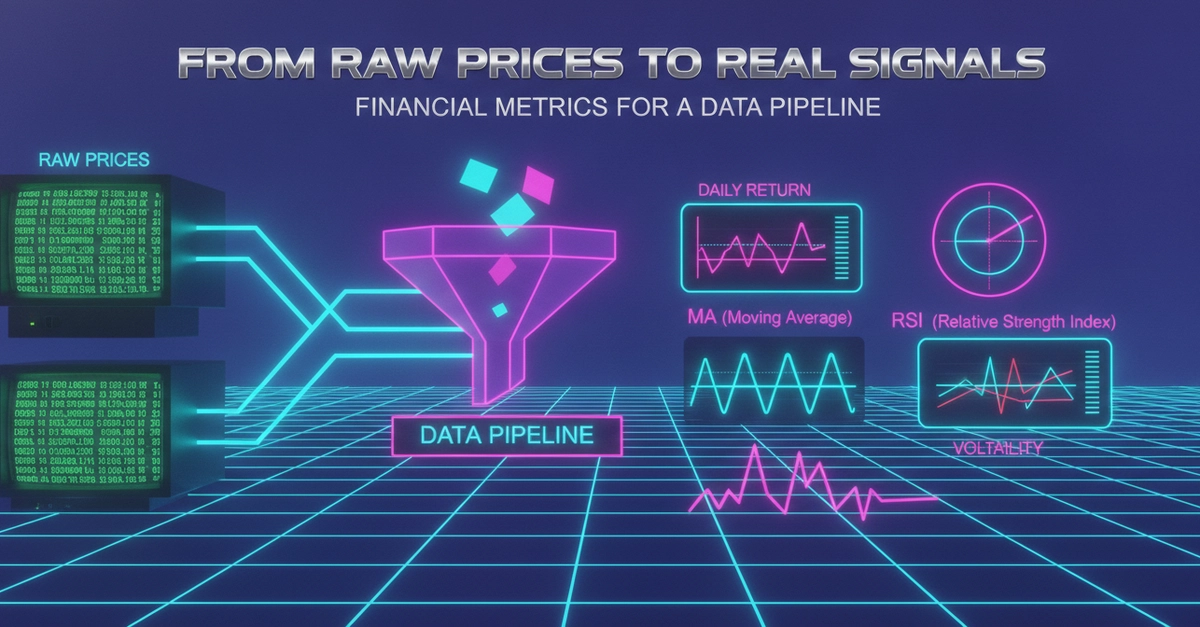
Neither tells you the numbers that actually matter: your annualized volatility, your Sharpe ratio, your beta against the market, your maximum drawdown, how correlated your positions really are with each other.
Institutional investors have had this for decades. Retail investors get a pie chart.
If you're: