In this article I will share my understanding and use of some financial metrics used in my Financial Dashboard project. You can see it in this link and the full article by clicking here.
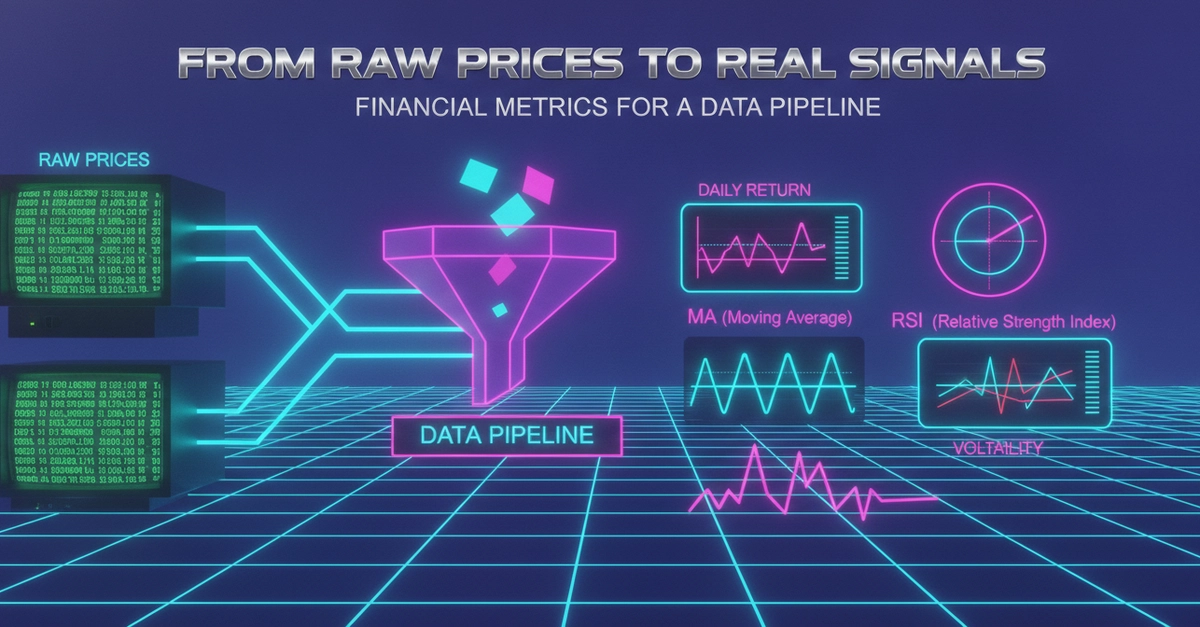
The main point here is understanding the math used to transform data from the bronze layer — where we have raw information such as date, open, high, low, close, and volume — and aggregate useful data to improve consumption and future use in the data pipeline.
First metric: Daily Return
Not a difficult one. It returns the percentage change between today's and yesterday's stock prices.
Why? Seeing day-to-day changes can be useful and later used in the gold layer for analysis.