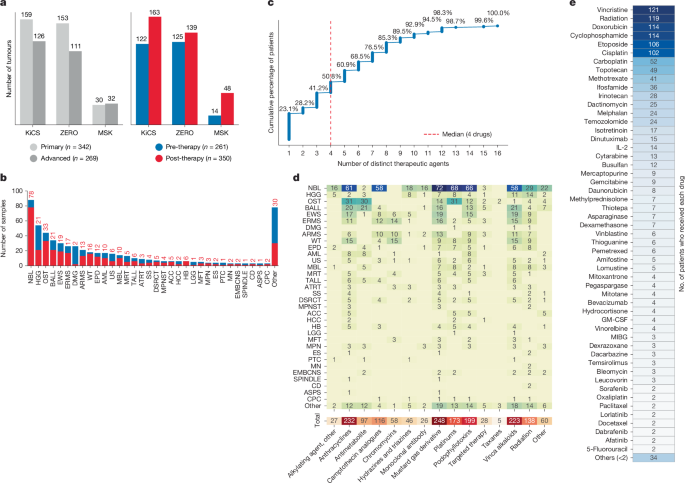
MainThe substantial improvement in childhood cancer survival rates has been achieved in part through therapy intensification, often at the cost of lifelong secondary effects6,7,8,9,10,11. Exposure to genotoxic radiation therapy and chemotherapy leads to chronic long-term physical and psychological complications, including growth hormone deficiency, hearing loss, obesity, cardiotoxicity, reproductive failure, endocrine system disruption, pulmonary dysfunction and a profound reduction in cognitive capacity12,13. In general, survivors of childhood cancer are 1.5–8 times more likely to develop a severe or life-threatening condition1,14,15,16,17. Among the many adverse effects of therapy, the development of specific secondary malignant neoplasms presents the greatest relative risks14,16. For instance, there is a dose–response relationship between alkylating agent exposure and the risk of secondary leukaemia18. Although the causal role of chemotherapy in secondary childhood cancer development is well established, its effect on tumour relapse and metastasis remains unclear.Chemotherapies can be associated with characteristic patterns of mutations found in the tumour genome, known as mutational signatures2. These signatures are potentially associated with the response of the patient to therapy, since to display them cancer cells must survive the therapy to which they were exposed19,20,21,22. A comprehensive identification of these signatures in childhood cancers could, therefore, guide treatment decisions, including therapy de-escalation. However, past studies have been hampered by the inclusion of small numbers of post-therapy tumours23,24, the use of targeted sequencing methods instead of whole-genome sequencing25, and the absence of key details regarding chemotherapeutic dose and timing23. For these reasons, it is currently not known when these therapy-associated mutational signals emerge, what scars are left on the genome by the many chemotherapies used in childhood cancer, or whether they are tissue-specific.Motivated by these questions, this study provides a comprehensive assessment of therapy-associated mutational signatures in paediatric cancer. We used 611 whole-genome-sequenced tumours from 3 precision medicine programmes focused on aggressive disease, combined with highly curated drug exposure details, to define the mutagenic impact of every major chemotherapy used in childhood cancer. Collectively, post-therapy tumours were massively impacted by past exposure, leading to higher mutation burdens in all classes of genomic variation. A detailed enrichment analysis uncovered novel chemotherapy–signature associations, both with validated mutagens such as platinum-based drugs and with previously suspected mutagens such as temozolomide. This enabled measurement of each drug’s mutagenicity, the timing of signature appearance in individual patients’ tumours, and the association between therapy signatures and treatment resistance or adverse clinical outcomes.Therapy data in a comprehensive cohortChildhood cancers are rare, and therefore require international collaboration to assemble sufficiently large cohorts for robust research23,24,25. We analysed whole-genome sequence data from large, prospective whole-genome sequencing programmes in Canada (SickKids Cancer Sequencing (KiCS)3), Australia (ZERO4) and the USA (MSK5), each of which enrols children with poor-prognosis cancers (Supplementary Note 1.1). In total, 611 tumour genomes from 544 patients, together with detailed information on exposure to 86 therapies derived from their medical records, were assessed to determine the mutagenic impact of therapy in children (Fig. 1 and Supplementary Tables 1–4; we refer to the combined cohort as KZM). Hereafter, we use ‘primary’ to describe any primary tumour site at initial diagnosis and ‘advanced’ to describe all other tumour states, including progression at primary site, relapse at primary site, metastasis at diagnosis or relapse, and second malignancy.Fig. 1: Overview of the KZM cohort.a, Composition of the KZM cohort, comprising samples from the KiCS, ZERO and MSK programmes. Bar charts show sample counts by disease state (primary versus advanced) and treatment status (pre-therapy versus post-therapy) for each dataset. b, Therapy exposure across tumour types in the KZM cohort. Stacked bars show the post-therapy (red) and pre-therapy (blue) samples by tumour type, ordered by total sample count. Post-therapy counts are shown above each bar. Tumour types with n < 2 or no treated samples are grouped under ‘other’. ACC, adrenal cortical carcinoma; AML, acute monocytic leukaemia; ARMS, alveolar rhabdomyosarcoma; ASPS, alveolar soft part sarcoma; ATRT, atypical teratoid rhabdoid tumour; BALL, B cell lymphoblastic leukaemia; CD, chordoma; CPC, choroid plexus carcinoma; DMG, diffuse midline glioma; DSRCT, desmoplastic small round cell tumour; EMBCNS, embryonal central nervous system tumour; EPD, ependymoma; ERMS, embryonal rhabdomyosarcoma; ES, epithelioid sarcoma; EWS, Ewing sarcoma; HB, hepatoblastoma; HCC, hepatocellular carcinoma; HGG, high-grade glioma; LGG, low-grade glioma; MBL, medulloblastoma; MFT, myofibroblastic tumour; MN, meningioma; MPN, myeloproliferative neoplasm; MPNST, malignant peripheral nerve sheath tumour; MRT, malignant rhabdoid tumour; NBL, neuroblastoma; OST, osteosarcoma; PTC, papillary carcinoma of thyroid; SPINDLE, spindle cell tumour, unclear diagnosis; SS, synovial sarcoma; TALL, T cell lymphoblastic leukaemia; US, undifferentiated sarcoma; WT, nephroblastoma (Wilms tumour). c, Empirical cumulative distribution function showing the proportion of patients who received up to a given number of distinct therapeutic agents. Each point on the curve corresponds to a unique therapy burden value and the cumulative percentage of patients who received that number or fewer drugs. Numbers above each step indicate the cumulative percentage up to each drug count. d, Therapy class exposure by tumour type. Heat map (top) showing the number of tumours per major tumour type (rows, same order as in b) that were exposed to each therapy class (columns). Aggregated totals across all tumour types are shown along the bottom. e, Drug-level exposure across the cohort. Each tile represents a therapeutic agent, with colour intensity scaled to the number of patients who received that drug, normalized to the most frequently used agent. Only drugs administered to at least two patients are shown individually; the remaining are aggregated into ‘others (<2)’. Patient counts are shown in each tile. GM-CSF, granulocyte–macrophage colony-stimulating factor; MIBG, metaiodobenzylguanidine.Source dataThe combined whole-genome cohort reflects the age distribution, therapeutic exposure and tumour types that are typical for paediatric cancer, especially for those with relapsed or metastatic disease. The median age at diagnosis of primary tumours was around 8 years (Extended Data Fig. 1a), and 57% of the samples were collected post-therapy (Fig. 1a). The diversity of tumour types reflects the long tail of diagnostic entities seen in children, with about 100 tumour types included (Extended Data Fig. 1b). For 56 tumour types, 3 or more samples were available, and for 15 tumour types there were 10 or more samples (Supplementary Table 1), including neuroblastoma (n = 88), high-grade glioma (n = 54) and osteosarcoma (n = 44).A detailed clinical re-annotation of the full cohort using a harmonized framework describing each patient’s cancer diagnosis, primary site, grade and stage, as well as every therapy they had been exposed to, was undertaken. Across the 3 contributing sites, 5 oncology fellows analysed all patients’ medical records to collect more than 3,200 detailed therapy data points (including cycle, date of each dose, dosage and route of administration; therapy exposures are summarized in Fig. 1b–e, with comprehensive details in Supplementary Tables 2–4.). Mustard gas derivatives were the most widely used class of chemotherapy (248 tumours, 41% of all tumours, 71% of post-therapy tumours), followed by anthracyclines (232 tumours, 38% of all tumours and 66% of post-therapy tumours; Fig. 1d). Out of 86 different therapeutic agents used to treat these patients, 52 drugs (Fig. 1e) from 13 major therapy classes (excluding radiation therapy; Fig. 1d) were given to 2 or more patients in these 3 cohorts. Half of treated children were exposed to four or more different agents (Fig. 1c).Increased mutation burden post-therapyTo explore the mutagenic impact of chemotherapy, we measured the mutation burden of all classes of mutations including: 14,954,228 single-base substitutions (SBSs) (median burden 1.042 mutations per Mb (mut Mb−1); range 0.059–562.8 mut Mb−1); 74,166 doublet-base substitutions (DBSs) (median burden 0.007 mut Mb−1; range 0–3.621 mut Mb−1); 2,161,880 small insertions and deletions (indels; IDs) (median burden 0.164 mut Mb−1; range 0.076–135.6 mut Mb−1); 45,693 structural variants (SVs) (median burden 0.013 mut Mb−1; range 0–0.505 mut Mb−1); and 84,119 copy number alterations (CNAs) (median burden 0.01 mut Mb−1; range 0–1.691 mut Mb−1; Fig. 2a). A recent study of 785 mostly treatment-naive paediatric tumours found a lower rate of mutations24. Similarly, the mutation burden of our treatment-naive primary tumours was less than half that of the treated advanced tumours (for example, median SBS burden of 0.726 mut Mb−1 versus 1.64 mut Mb−1). By contrast, the treated primary tumours did not show significantly higher mutation burdens compared with treatment-naive primary tumours, except for DBSs (Fig. 2a), potentially owing to a shorter time between the start of therapy and the sample collection (median: 109 days versus 622 days for treated advanced tumours; Extended Data Fig. 1c). The higher mutation burden post-therapy was seen in many tumour types, suggesting that it was not a tissue-specific effect; although some entities, such as ependymoma and osteosarcoma, had an especially large post-therapy increase in SBS mutation burden (Fig. 2b).Fig. 2: Mutational burdens across treatment status and cancer types.a, Somatic mutation burden (total number of variants divided by the length of the reference genome) are shown for major types of genomic variants. In addition to the overall burden in the cohort, we also show the burdens for treatment-naive (primary naive), and treated primary (primary treated) and advanced (advanced naive and advanced treated), tumours. Each point represents the burden for a single sample, and the red horizontal lines indicate the median burden. The number of samples in each category is shown below the horizontal axis. The dependent variable (mutation burden) was first rank-transformed, and the effects of covariates (age, sex and tumour purity) were regressed out via ordinary least squares linear regression. The resulting residual ranks were then compared across groups using a one-way ANOVA (F-test; two-sided). For post hoc comparisons, pairwise Wilcoxon rank-sum tests (two-sided) were performed, with P values adjusted for multiple comparisons using the Benjamini–Hochberg false discovery rate procedure at α = 0.05. b, Somatic SBS burden for major tumour types (those with a minimum of five primary naive and five advanced treated samples). All figure elements are the same as in a. P values are calculated as in a and indicate the significant increase in SBS burden post-therapy. As only two groups were compared (pre-therapy versus post-therapy for each tumour type), no post hoc pairwise test or adjustment for multiple comparisons was performed.Source dataWe catalogued 641 driver events in the cohort with exact positional matches in at least 1 of 3 driver databases. After filtering for germline polymorphisms and mapping artefacts, 455 high-confidence events across 129 genes remained (Extended Data Fig. 2 and Supplementary Table 5). Moreover, using an inclusive union approach across 4 established driver detection tools, we catalogued and annotated 39 COSMIC Cancer Gene Census genes with recurrent mutations in our cohort (Supplementary Table 6).Signature diversity in paediatric cancerA comprehensive signature analysis of SBS, DBS and ID mutations, as well as SV and CNAs, uncovered 65 COSMIC and 29 novel (non-COSMIC) mutational signatures in this childhood cancer cohort (Supplementary Tables 7–11 and Supplementary Note 1.2). Hypermutant tumours were analysed separately to prevent the masking of signatures by a small number of cases (34 hypermutants and 577 non-hypermutants based on SBS burden; Extended Data Fig. 3). SBS signatures were derived using 288 mutational channels26.Among the 577 low-burden tumours, 20 de novo SBS signatures were found (Extended Data Fig. 3). These were then decomposed into 23 known COSMIC signatures, 1 previously reported signature27, which is not yet in COSMIC, and 4 potentially novel signatures. The 34 hypermutant cases yielded 13 de novo SBS signatures, decomposing into 18 COSMIC and 5 potentially novel signatures (Extended Data Fig. 4a). Eleven of the previously known signatures and one of the novel signatures were found in both low- and high-burden tumours (Extended Data Fig. 3). Those found exclusively in hypermutators were primarily associated with mismatch repair and/or polymerase epsilon or delta deficiency (Extended Data Fig. 4a). For simplicity, all the non-COSMIC (v3.2) signatures extracted in this study are designated as ‘novel’ (see Supplementary Tables 12–16 for numerical spectra and Supplementary Note 2 for visualizations).In addition to SBS signatures, 12 DBS signatures (9 COSMIC and 3 novel), 17 ID signatures (9 COSMIC and 8 novel), 11 SV signatures (8 COSMIC and 3 novel) and 14 CNA signatures (8 COSMIC and 6 novel) were extracted from the whole cohort (Extended Data Fig. 4b,d–f). These findings reveal that the number of signatures in childhood tumours is far higher than previously appreciated, suggesting a broad array of underlying mutagenic processes (see Supplementary Note 1.3 and Supplementary Figs. 1–3 for an overview of the main signature interaction networks; Supplementary Note 1.4 for SV and CNA signatures; and Supplementary Note 1.5 for robustness test of novel signatures).Therapy drives mutational signaturesExcluding SV and CNA signatures, which are not as well defined, a notable proportion of the mutational signatures were found exclusively in treated tumours. In low-burden tumours specifically, 15 out of the 56 signatures (27%) were exclusively found in treated tumours, whereas no signature was exclusive to treatment-naive tumours (binomial test accounting for cohort sizes, P value = 0.00026). Of these 15 signatures, 10 remained therapy-exclusive across both low-burden and high-burden tumours (Supplementary Note 1.6). These signatures highlight the disproportionate mutagenic effect of chemotherapy on childhood cancers (Supplementary Fig. 4). Among the low-burden tumours, 9.68% of the SBSs were attributed to a single class of chemotherapy—platinum drugs (SBS31 and SBS35; Fig. 3a), which caused the highest number of variants (235,519 SBSs) in the largest number of samples (67 tumours; Supplementary Table 7). Similarly, the DBS platinum signature (DBS5) was responsible for 2,693 DBSs (13.5% of all DBSs), increasing the number of platinum-treated samples with COSMIC platinum signatures to 71 tumours (Extended Data Fig. 4c and Supplementary Table 8).Fig. 3: Mutational activity and therapy associations of COSMIC and novel mutational signatures in paediatric cancers.a, Somatic mutations attributable to COSMIC or novel mutational signatures. The proportions of mutations found in low-burden tumours (n = 577) in the cohort irrespective of past therapy exposure are shown. These are divided into mutations associated with any therapy (including platinum) versus those specifically associated with platinum therapies, and then further divided by mutation type (SBS and DBS). b, Mutation burden (somatic mutations per Mb) of therapy-associated SBS signatures (COSMIC and novel) detected across all tumour genomes (n = 611). Each dot represents one sample; red lines indicate median values and dashed lines show reference thresholds. The number of samples carrying each signature is shown below the horizontal axis. c, Association between mutational signatures and therapeutic classes. Each circle represents a significant association (one-tailed empirical P value < 0.05, AUROC ≥ 0.7 and regression coefficient ≥ 0.7), with size proportional to the regression coefficient (log of odds ratio; shown in circles) and colour indicating the observed AUROC scores from the logistic regression model. Novel and COSMIC signature names are shown in green and black, respectively. d, Same as c, but for individual therapeutic agents. Beyond the primary therapy associations detailed in the main text, we identified secondary associations that either failed robustness testing, arose from treatment co-occurrence rather than direct causation (for example, DBS5 with antimetabolites) or reflected well-known endogenous processes (for example, SBS13 with anthracyclines). These are further discussed in Supplementary Note 1.7.Source dataThe ubiquity of the platinum signatures is partially explained by the frequency with which such therapies are used in childhood cancer—28.3% (173 out of 611) of the cohort has been exposed to carboplatin, cisplatin and/or oxaliplatin (Fig. 1d). Additionally, platinum drugs seem to have a higher ‘penetrance’ than other compounds, with 41% of platinum-exposed tumours displaying the characteristic COSMIC signatures of platinum exposure (Extended Data Fig. 4c). This is consistent with prior in vitro exposure data in which cisplatin induced more mutations than seven other drugs in a cell line model28.The remaining COSMIC chemotherapy-associated signatures were: SBS11, attributed to temozolomide29, found in only 0.008% of the mutations (2 tumours); SBS17b (ref. 30), attributed to 5-fluorouracil31, found in 0.5% of mutations (10 tumours); and SBS87, a thiopurine associated signature32 found in 0.7% of mutations (8 tumours; Fig. 3b). The only COSMIC (v3.2) signatures associated with a specific agent that were not detected here were SBS32 (associated with azathioprine) and SBS90 (duocarmycin), reflecting the fact that none of our patients had been treated with either agent. Together, and using a very conservative set of signatures, we conclude that 15.1% of the point mutations in childhood tumours are caused by just four chemotherapies.In summary, 50 out of the 69 mutational signatures were found in both pre- and post-therapy childhood tumours. This included COSMIC signatures associated with endogenous processes, such as age (SBS1 and SBS5), APOBEC deamination (SBS2 and SBS13), reactive oxygen species (SBS18) and others, including several potential sequencing artefacts (contributing 2.36% of SBS mutations; Extended Data Fig. 4g).Increasing therapy-associated signaturesTo define the specificity of known signatures to drugs and to find novel signature–drug associations, we performed an enrichment analysis at both the level of the therapy class (Fig. 3c) and of the individual drugs (Fig. 3d). Only drugs for which five or more tumour samples were available from treated patients were included in this enrichment analysis, and only drug–signature associations (adjusted for age, sex and tumour purity) with regression coefficient ≥0.7 (equivalent to odds ratio of approximately 2), area under the curve of a receiver–operator curve (AUROC) score ≥ 0.7 and P value < 0.05 (calculated from 5,000 permutations) were reported.Two indel signatures, ID5 and ID8, were found significantly associated with radiation, as previously reported in adult cancers33,34. Moreover, a novel CNA signature (CN48A) was also significantly associated with radiation (Fig. 3c). Tumours treated with 5-fluorouracil had the expected SB17b signature, but the association did not reach our statistical cut-off because of small numbers (2 out of 3 treated tumours had SBS17b; Supplementary Table 17). SBS11 was the most challenging signature to detect in our cohort, and we could reliably detect it in only two tumours (Supplementary Table 18 and Supplementary Note 1.2). Temozolomide (and its class, hydrazines and triazines) was also found to be significantly associated with SBS288L3 (a previously reported signature primarily comprising T>C mutations27; Supplementary Table 19).Of the 12 tumours for which details on past exposure to thiopurines was available, 1 had received thioguanine only, 5 received 6-mercaptopurine only, and 6 samples were treated with both thiopurine drugs. However, none showed the SBS87 signature, which has been previously associated with thiopurines32, using the de novo signature approach. Two of these tumours did match SBS87 when using a signature-refitting approach (Supplementary Table 20). The SBS87 signature appears to be specific to leukaemia and lymphomas, as none of the four non-liquid cancers exposed to thioguanine, mercaptopurine or other antimetabolites displayed SBS87.Platinum-treated tumours had a significant and specific enrichment for COSMIC signatures SBS31, SBS35 and DBS5, as expected. We found additional signatures enriched in platinum-treated tumours (Fig. 3c,d), including two DBS signatures: DBS6, which does not have a known aetiology; as well as a novel signature, DB78H2, which is mostly comprised of CT>AC mutations. Platinum-treated tumours were also enriched for signature SBS288L5, which is similar, but not identical, to a previously reported platinum signature2 (cosine similarity = 0.897; Extended Data Fig. 5). We further validated the two novel platinum-associated signatures using independent paediatric35 and adult cancer datasets36 (Supplementary Tables 21 and 22 and Supplementary Note 1.5). An additional ID signature, ID3, was significantly enriched in platinum-treated tumours. This signature was previously reported to be associated with tobacco smoking27 as well as platinum therapies24. Here we found it to be a non-specific signature also significantly associated with epipodophyllotoxins (such as etoposide) and nitrogen mustard derivatives (for example, melphalan), among others.Of note, neither of the two children treated with oxaliplatin showed any SBS platinum signatures. Instead, one had DBS5 and the other had the novel signature DBS78H2 (Supplementary Table 8). To validate this, we analysed a cohort of adult cancers36, which are more frequently treated with oxaliplatin. A similar trend was observed: only 2 out of the 59 tumours treated with oxaliplatin carried SBS35, whereas 9 samples exhibited DBS5 (Supplementary Note 1.2 and Supplementary Table 23).Finally, two novel signatures (SBS288L2 and SBS288L4; Fig. 3c,d) were significantly associated with therapy, but not specifically to one class or compound. These two novel signatures were validated in an independent paediatric dataset35 (present in seven and six treated samples, respectively; Supplementary Table 22). Together, we identified a total of 69 distinct SBS, DBS and ID signatures that were active in childhood cancers; 20 out of the 69 were novel, and 15 of the 69 signatures were found exclusively in treated tumours. Of these 15 therapy-associated signatures, 10 corresponded to known COSMIC signatures, whereas 5 were novel. Specifically, two of the novel signatures (SBS288L5 and DBS78H2) were associated with platinum therapy and one was associated with temozolomide (SBS288L3). The remaining two (SBS288L2 and SBS288L4) were novel pan-therapy signatures that were linked to multiple chemotherapeutic agents (Supplementary Table 24; see Supplementary Figs. 5 and 6 for multi-drug associations). Notably, our novel platinum signatures demonstrated clear links to platinum-induced DNA damage. SBS288L5 is enriched in transcription-biased C>A and T>A mutations resulting from transcription-coupled repair of GpG and ApG intrastrand crosslinks caused by platinum agents37. Similarly, DBS78H2 is enriched in CT>NN mutations arising from cisplatin-induced ApG adducts38. The validity of these novel signatures was further confirmed by assessing their activity in tumours and the support for them in the cohort (Supplementary Table 25 and Supplementary Note 1.5).Therapy signatures emerge rapidlyWe examined the influence of drug dose, timing, tumour type and clonality on the presence or absence of platinum-associated mutations, particularly since we found that platinum drugs were the most potent mutagen class in childhood cancers.Across the whole cohort, 173 tumours had been exposed to platinum drugs, of which 71 (41%) carried one of the COSMIC platinum signatures (SBS31, SBS35 or DBS5; Extended Data Fig. 4c). Of the platinum-treated samples, 31% (54 out of 173) were primary tumours, yet only 16.6% (9 out of 54) of these carried a COSMIC platinum signature. The interval between a tumour’s exposure to platinum and the sample acquisition was shorter for primary cancers (Extended Data Fig. 1c), suggesting that the absence of a corresponding drug signature was, in part, due to the timing of tumour excision. Treated primary cancers also had lower total mutation burdens (median SBS of 3,461.5 versus 6,746.5) and less cumulative therapy exposure (median normalized dose of 0.159 versus 0.194 mg m−2). All of these factors influence the enrichment of platinum signatures in advanced tumours. Moreover, correlation analysis confirmed that platinum signature exposure was significantly associated with mutation burden across all five platinum signatures (Pearson’s r = 0.65–0.87, R2 = 0.42–0.76, all P values < 10−6; Extended Data Fig. 1d).Using therapy exposure dates (available for 141 out of 173 platinum-treated tumours), we found that the earliest detectable platinum signature was 91 days after the start of therapy and required a minimal mutation burden of 1,454 substitutions (or 0.5 mut Mb−1; Fig. 4a). Of these tumours, 79% were above both the time and burden thresholds (111 out of 141 tumours), of which 59% (65 out of 111) had one or more platinum signatures. Adding our newly found platinum signatures increased the number of tumours displaying therapy scars by about 14%. Overall, 73% of the tumours with the requisite mutation burden and exposure duration displayed platinum signatures. These two thresholds were further confirmed in an independent adult cancer cohort (in all but two tumours; Extended Data Fig. 6a and Supplementary Note 1.7). Further, deep targeted sequencing of 51 tumours (from Fig. 4a) revealed emerging platinum signals in samples collected before 91 days, suggesting that ultra-rare subclones with faint signals of drug-related signatures may be found at an earlier time point (Supplementary Fig. 7). Notably, tumours without drug-related signatures, despite exceeding time and mutation burden thresholds, did not display a therapy signal at a higher depth of sequencing. This indicates that by around 3 months post-therapy the platinum mutational footprint appears to be already fixed; tumours that were negative by whole-genome sequencing at this point are likely to be truly negative for the mutagenic impact of platinum therapy.Fig. 4: Mutational signature analysis of platinum exposure.a, All the platinum-treated KZM samples with available detailed therapy information are shown. See Supplementary Table 1 for the full tumour names. The top right quadrant depicts where we expect the tumours to manifest the imprints of platinum therapy (samples that pass both burden and time thresholds). A summary plot of the number of samples from this quadrant with (Sig+) and without (Sig−) platinum signatures for each cancer type is provided on the right-hand side. AF, aggressive fibromatosis; COST, chondroblastic osteosarcoma; CRC, colorectal carcinoma; GCT, germ cell tumour; HOG, Hodgkin lymphoma; MAO, mucinous adenocarcinoma (ovarian); NE, neuroepithelioma; Neo, malignant neoplasm; PBL, pineoblastoma. b, Left, comparison of platinum therapy against all therapies combined (including platinum therapies), showing the percentage of KZM participants who exhibit therapy-associated signatures over time. Key milestones, including signature prevalence at 12 months and time to 50% prevalence, are marked in red. Right, the same analysis for two other major therapeutic classes: anthracyclines and antimetabolites. Platinum-specific signatures were used for the platinum curve, and the composite set of all therapy signatures (Fig. 3b) was used for other therapy curves owing to the absence of known anthracycline-specific mutational signatures and low abundance of antimetabolite signatures in our cohort. Mo, months.Source dataTherapy signatures track recurrenceHaving defined the minimal time needed for therapy scars to appear, we measured penetrance of each drug as a function of time across the whole cohort. For each time point (that is, number of months since start of therapy), we determined the proportion of tumours with at least one platinum signature among all the tumours collected up to that time point (Fig. 4b). Remarkably, 35% of the tumours treated with platinum-based drugs displayed a corresponding signature within just 12 months, demonstrating the rapid effects of the drugs on the genome. This increased to 48% by 18 months and reached the 50% mark at 33 months, then plateaued. This signature emergence was even more accelerated in metastatic tumours (Extended Data Fig. 6b). Of note, the shape of this curve reflects the dynamics of relapse in childhood cancer, which increases quickly in the first 1–2 years post-therapy and then levels out, as reported in cancers such as acute lymphoblastic leukaemia39,40,41 and medulloblastoma42.In comparison, only 17% of treated tumours (those treated with any therapy, including platinum therapies) carried signatures of therapy within the first 12 months (Fig. 4b). This proportion increased to 21% at 18 months and 25% at the 34-month time point. It finally reached a plateau of around 27% at 45 months after the start of therapy. As we had seen that platinum drugs are associated with more DNA damage than other therapies, we examined two other major chemotherapies: anthracyclines and antimetabolites (Fig. 4b). They had very similar kinetics within the first 12 months of exposure (penetrance of 28% and 27%, respectively). However, whereas anthracyclines reach 40% penetrance at 24–28 months of exposure, antimetabolites reach the same point after more than 41 months of exposure. We therefore conclude that platinum drugs leave more pronounced mutational footprints at earlier time points than anthracyclines or antimetabolites, consistent with their greater genotoxic impact. Larger prospective studies will be required to confirm whether the dynamics of these signatures reflects the time-dependent risk of recurrences in childhood cancer.Platinum exposure drives poor outcomesTo better define the association between therapy-induced mutational signatures and clinical resistance, we performed complementary analyses using transcriptomic data, outcome data from additional cohorts and chromosomal instability signatures. RNA sequencing of platinum-treated tumours revealed the significant overexpression of established resistance genes in signature-positive samples, including GSTA1 and ABCC2, which mediate platinum detoxification and efflux, respectively (Fig. 5a). This coordinated activation of the resistance machinery occurred independently of disease stage and treatment exposure duration. Furthermore, analysis of clinical outcomes in two independent paediatric and adult cancer cohorts demonstrated that patients carrying platinum signatures showed significantly worse clinical outcome. In the paediatric cohort (n = 15 patients treated with platinum35; Fig. 5b), all patients with progressive disease sampled more than 91 days post-therapy displayed strong platinum signatures, and patients who were signature-positive who were initially classified as responders showed higher rates of late recurrence. Similarly, in a large adult metastatic cancer cohort43 (n = 166), patients with platinum signatures in primary tumours were significantly more likely to develop progressive disease when re-treated with platinum agents for metastatic disease (Fig. 5c). Finally, a chromosomal instability signature analysis revealed a significant enrichment of the CX5 signature, which was previously shown to be predictive of resistance to platinum-based drugs44, in signature-positive samples (Extended Data Fig. 6c). These findings provide molecular and clinical evidence supporting the association between therapy-induced mutational signatures and treatment resistance (see Supplementary Note 1.8 for more details).Fig. 5: Platinum mutational signatures and clinical outcome.a, Enrichment of two key platinum resistance genes (GSTA1 and ABCC2) in signature-positive versus signature-negative tumours. Signature+ > thresholds, n = 62; signature− > thresholds, n = 50, and signature− < thresholds, n = 24. The first two columns are signature-positive and signature-negative samples from the top right quadrant of Fig. 4a, that is, samples that passed both time and burden thresholds. The third column are samples that did not pass the thresholds and did not show platinum signatures. Differential expression was assessed using a two-sided Wald test; P values were adjusted using the Benjamini–Hochberg false discovery rate procedure. Box plots show the median (centre line), interquartile range (box bounds: 25th–75th percentile) and 1.5× interquartile range from the box bounds (whiskers). Individual data points are overlaid as dots. Violin plots show the kernel density estimation of the data distribution. Padj, adjusted P value. b, Worsening of clinical response in signature-positive tumours. All paediatric patients with progressive disease (PD) sampled more than 91 days post-therapy showed strong platinum signatures. Six additional patients who were signature-positive who were initially recorded as partial response (PR), complete response (CR) or stable disease (SD) later developed recurrence or metastasis. No platinum signature was detected in five complete response or partial response tumours, suggesting either treatment sensitivity or the presence of sub-detection-threshold resistant clones. WGS, whole-genome sequencing. c, In a cohort of 166 patients treated with platinum (Hartwig Medical Foundation) who developed metastases and were re-exposed to platinum therapies, the presence of platinum signatures in the primary tumour was consistently associated with worsening clinical response in the metastasis. At the time of last clinical evaluation, patients with platinum signature (compared to those without) had 2.24-fold higher odds of progressive disease versus stable disease and 2.88-fold higher odds of progressive disease versus partial response or complete response. The association between platinum signatures and progression remains significant after adjusting for primary histology (Cochran–Mantel–Haenszel P value = 0.0097; odds ratio (OR) = 3.41), metastatic site (Cochran–Mantel-Haenszel P value = 0.0176; OR = 3.20), and platinum treatment frequency (multivariate logistic regression P value = 0.018; OR = 2.98). All odds ratios are reported with 95% confidence intervals (CIs); P values are two-sided. NS, not significant.Source dataPlatinum features via machine learningOf the platinum-treated tumours, 27% lacked detectable platinum signatures despite sufficient exposure. To explore whether additional genomic damage existed beyond conventional mutational signature analyses, we trained an ensemble machine learning classifier using SBS96, SBS288 and SBS1536 mutation types as features (Extended Data Fig. 7a,e,f). The classifier distinguished platinum signature-positive tumours with high accuracy (F1-score: 0.89). Critically, removing known platinum signals reduced the classifier’s performance by about 10% (F1-score: 0.81–0.82; Extended Data Fig. 7b,g,h), suggesting that there are additional platinum-associated genomic features beyond the conventional signatures. Additionally, our ensemble model robustly distinguished platinum-exposed tumours from treatment-naive tumours (Extended Data Fig. 7c). Key discriminating features, including trinucleotides not captured by COSMIC signatures, were also successfully detected (Extended Data Fig. 7d). The model generalized to adult platinum-treated tumours (cosine similarity = 0.72), supporting broad applicability (Extended Data Fig. 7i) despite differences between paediatric and adult cancer cohorts (Extended Data Fig. 8). For SVs and CNAs, only a few therapy-specific features were identified, probably reflecting the limited resolution of current SV and CNA signatures (Extended Data Fig. 9). Together, these data suggest that there are additional platinum-associated genomic features that are not represented by conventional mutational signatures (see Supplementary Note 1.9 for more details).DiscussionThis study rigorously quantified the mutagenic effects of chemotherapy on relapsed childhood tumours, quantitatively cataloguing each major drug’s associated mutational signatures and revealing how they shape disease at relapse or metastasis. Post-therapy tumours carried significantly higher mutation burdens, with drug-associated alterations often being the single largest contributor, and chemotherapy and radiation therapy were the only exogenous mutagens with a detectable effect in these tumours from young patients. It is clear that cancer cells that were not killed by the therapy were still substantially and specifically marked by it.Several important differences emerged from combined analysis of chemotherapy dose, duration and timing with in-depth mutational signature profiling. First, platinum-based drugs drove about 60% of all therapy-related mutations and had higher penetrance than other agents (51% versus 26% of exposed tumours). Second, by 18 months, 48% of platinum-treated tumours with sufficient variants were signature-positive. Third, some signatures were tissue-specific: antimetabolite signature SBS87 appeared exclusively in leukaemias and lymphomas, and osteosarcoma was around 1.5 times more likely than neuroblastoma to carry platinum-associated mutations given equivalent exposure (Fig. 4a).We found 69 distinct SBS, DBS and ID signatures to be operative in childhood cancer, 30 more than previously reported24. We more than doubled the number of identified platinum-associated signatures, uncovering novel associations with both known and new signatures, while providing substantial evidence for several therapy-related novel signatures. However, our cohort was predominantly composed of rare cancers with limited sample sizes per type, and childhood cancers typically carry significantly fewer mutations than adult cancers45. As a result, many of these novel signatures remain to be thoroughly characterized in future studies.We found that advanced tumours with drug-related signatures carried more drivers on average than those without the signatures (0.75 versus 0.45 and 0.46 versus 0.21 mutations per tumour with and without hypermutators, respectively; Extended Data Fig. 2a), yet the distribution of the affected driver genes was similar between signature-positive and signature-negative cases, with no statistically significant enrichment of particular genes (Extended Data Fig. 2b). Thus, although therapy-induced mutagenesis increases overall mutation burden, it does not appear to preferentially introduce novel drivers beyond those that are commonly observed in paediatric cancers. Fully disentangling therapy-induced from pre-existing drivers will require larger, homogeneous and longitudinally sampled cohorts. In platinum-treated tumours without detectable platinum signatures, a subclonal analysis uncovered hidden platinum signatures in five cases (Extended Data Fig. 10a, Supplementary Fig. 8, Supplementary Table 26 and Supplementary Note 1.10), indicative of emerging therapy-induced clones that were not yet clonally dominant. Analysis of clustered mutations revealed no additional hidden signatures (Extended Data Fig. 10b–e and Supplementary Note 1.11). Longer follow-up of these patients will be required to determine whether the absence of these signatures is associated with improved survival.Considering all drug classes, a quarter of treated patients showed a therapy-associated signature within three years of treatment initiation. These signatures offer a foundation for future work on early detection of resistant clones and reducing the negative long-term impacts of cancer therapy.MethodsPatients, therapy data and whole-genome sequencingPatient enrolment, sample and data collection, and whole-genome sequencing were done independently for each cohort3,4,5. For KiCS, samples were sequenced on Illumina HiSeq X with target depth of 30× for normal tissue and 30× or 60× for tumours. Samples from ZERO were also sequenced on Illumina HiSeq X with target depth of 30× for normal tissue and 60× or 90× for tumours. MSK samples were sequenced on Illumina NovaSeq 6000 with target depth of 50× for normal and 95× for tumours. For therapy data collection, all three programmes used the same template with detailed therapy-related fields to retrospectively extract and collect all the available treatment details from the patient charts (Supplementary Table 2). The deep panel sequencing (~1,000× depth, using a >800-gene panel) and processing was performed as described3.Detection of somatic alterationsFor all three cohorts, raw FASTQ files were aligned to the human reference genome (GRCh37d5) using BWA-MEM46. Somatic alterations were identified by comparing each tumour sample to its matched normal sample. For solid and central nervous system tumours, the normal sample was typically blood-derived. For haematologic malignancies, a skin biopsy was generally used as the normal. For KiCS, somatic single-nucleotide variants (SNVs) and small indels were identified using Mutect2 (GATK v4.1.3)47. CNAs in the genome were identified using PURPLE (v1.4.10)48 and SVs were called using gridss (v2.9; default parameters)49. For ZERO, somatic SNVs and small indels were identified using Strelka (v2.0.17)50 and CNAs were detected using PURPLE (v2.39)48, while SVs were called using gridss (v2.72)49. For MSK, SNVs were identified using Strelka2 (v2.9.1)50, Mutect2 (GATK v4.0.1.2)47 and CaVEMan (cgpCavemanWrapper v1.7.5)51. CNAs were detected using Battenberg (cgpBattenberg v1.4.0)52. Small indels were detected using Strelka2, Mutect2 and Pindel (cgpPindel v1.5.4)53, and filtered against a panel of 100 unmatched normals. For multiple callers, we used a consensus of minimum two out of three callers. Further, SVs were called using gridss (v2.2.2). All SNV and indel variants across the three cohorts were annotated using VEP (v3.4)54. We applied a multi-tier filtering strategy to retain high-confidence SV calls across all three cohorts. Variants were required to meet the following criteria: variant quality ≥500, mean mapping quality ≥20, assembly support from both the breakpoint and remote break-end, variant-supporting fragments ≥1, and either split reads ≥2 or read pairs ≥2. All variants required assembly-based support with precise breakpoint resolution. Additional filters included minimum SV length ≥50 bp (for non-break-end variants), variant allele frequency (VAF) ≥ 0.05, and exclusion of extreme strand bias (0.05 ≤ strand bias ≤ 0.95). For break-end variants representing interchromosomal translocations or complex rearrangements, both break-end pairs were required to independently satisfy all criteria to ensure robust structural variant calls. For more detail on whole-genome sequencing processing and variant filtering see refs. 3,4,5.Mutational signature analysisPlotting the distribution of samples mutation burden revealed two separate subsets of high and low-burden samples with separation line at 25,000 mutations (8.628 mut Mb−1; Extended Data Fig. 3). Therefore, to avoid stronger signals in high-burden hypermutators potentially masking the signatures in low-burden samples, we ran mutational signature de novo extraction separately on these two subsets. The low- and high-burden subsets consisted of 577 and 34 samples, respectively. A similar approach was adopted to extract DBS and ID signatures. Plotting the distribution of the samples’ DBS burden revealed two separate subsets of low and high-burden samples (444 and 166 samples, respectively). ID analysis revealed three subsets of low, intermediate and high burden levels (89, 487 and 35 samples, respectively; Extended Data Fig. 3).SigProfilerMatrixGenerator (v1.1.31; default parameters)26 was used to generate SBS288, DBS78 and ID83 mutation matrices from our general cohort as well as clustered mutations. In addition to the classic 96 mutation channels (each single-base substitution and its immediate 5′ and 3′ flanking bases), the SBS288 mutational context includes the strand orientation for mutations occurring in the genic regions. Platinum-based drugs, as well as other chemotherapies, such as nitrogen mustards, thiopurines and various alkylating agents, are known to create DNA lesions preferentially repaired by transcription-coupled nucleotide excision repair (TC-NER) which targets lesions on the transcribed strand of active genes32,55,56. Because TC-NER is strand-specific, it introduces a transcriptional bias in mutation patterns. Thus, we used the SBS288 mutational context to enhance our ability to detect and interpret therapy-associated mutational signatures. All SBS, DBS and ID mutational profiles are described elsewhere26. SigProfilerExtractor (v1.1.3)57 was applied to the generated matrices to extract de novo mutational signatures from both the general cohort and the clustered mutation categories. This tool, which uses non-negative matrix factorization to decipher de novo mutational signatures and their relative activities in a cohort, was started using random initialization and was run for 100 replicates. The default values were used for all other parameters. Finally, SigProfilerExtractor decomposed the extracted mutational signatures into the COSMIC (v3.2) set of known signatures. In case of SBS288, the extracted signatures were first collapsed into SBS96 before decomposition into COSMIC signatures. SigProfilerAssignment (v0.1.1; default parameters)58 was used as the refitting approach for signature assignment.Enrichment analysisWe devised a logistic regression model, with adjustment for age, sex and tumour purity, to infer associations between therapies and mutational signatures. The model (penalty = ‘l1’, solver = ‘liblinear’) estimated main effects for each drug (restricted to those administered to ≥5 tumours) as well as all pairwise interaction terms (that is, synergistic effects). To evaluate significance, we calculated the observed AUROC for each drug–signature association, followed by a permutation test. This test involved randomly shuffling the binary outcome labels (presence or absence of the signature) 5,000 times and recalculating the AUROC each time. We then computed a one-tailed empirical P value as the proportion of permutations in which the permuted AUROC was greater than or equal to the observed AUROC. Associations were considered significant if they met all three thresholds: P value < 0.05, AUROC ≥ 0.7 and regression coefficient ≥ 0.7 (OR ≈ 2).RNA sequencing analysisRNA sequencing data were obtained from Villani et al.3 and Wong et al.4, and full details of RNA extraction and sequencing protocols can be found in refs. 3,4. Differential gene expression analysis was performed using pydeseq2 (v0.5.1) and Python (v3.11.6). All platinum-treated samples (Fig. 4a) with available RNA sequencing data (n = 68) were divided into three groups: a signature-positive group consisting of tumours that passed the both burden and time thresholds and bear platinum signatures; a signature-negative group consisting of tumours that passed both thresholds but had no platinum signatures; and a control group consisting of tumours that did not pass either threshold, and had no platinum signatures. We performed differential expression analysis between signature-positive and signature-negative groups with source institution (KiCS and ZERO) and disease state (primary treated and advanced treated) as covariates. Differentially expressed genes were identified using a Wald test, outliers were filtered using Cook’s distance, and P values were adjusted with the Benjamini–Hochberg procedure. Similarly, we performed differential expression analyses between each of signature-positive and signature-negative groups and the control group separately. Owing to the low number of samples for the majority of tumour types, we could not include tumour type as a covariate in the analyses.Driver analysisA two-pronged analysis was performed combining a database-driven approach with a complementary tool-based strategy. In the first approach, we used COSMIC (v101)59, OncoKB (v3.4) and Cancer Genome Interpreter (CGI) databases60. From COSMIC, we included only variants reported as somatic in one or more cancer types and occurred in at least ten samples. From OncoKB, we selected variants classified as oncogenic or probably oncogenic, and from CGI, we retained only the validated catalogue of oncogenic mutations. We focused on canonical functional variants: missense and nonsense mutations, frameshift insertions and deletions, and splice site alterations. Driver variants were filtered against germline variant databases (gnomAD v2.1.1 and ExAC v0.3 for GRCh37) to remove probably germline polymorphisms and mapping artefacts. Variants with allele counts >50 in databases were flagged as population polymorphisms. Additionally, variants mapping to problematic genomic regions were identified and removed based on abnormal allele frequency distributions in germline databases, indicated by either: (1) presence at high frequency (>50 samples) but consistently at low VAF (< 0.3 in >95% of instances), lacking heterozygous VAF patterns (0.3–0.7) expected for true variants, indicative of systematic mapping artefacts; or (2) presence at high population frequency but lacking homozygous genotypes, indicative of reference genome alignment issues. To distinguish rare germline indels from true somatic events, we evaluated the distribution of VAFs. Variants with VAFs clustering around 0.5 or 0.7–0.9 (consistent with heterozygous inheritance with or without subsequent copy number-induced shifts) were flagged as likely to be germline. Conversely, variants exhibiting subclonal VAFs or significant inter-sample VAF discordance were retained as somatic events. After excluding variants flagged as population polymorphisms or mapping artefacts, we identified 455 driver events with exact position matches. In our tool-based strategy, on the other hand, we used four established driver detection tools: CBaSE (v1.2)61, dNdScv (v0.0.1.0)62, MutSig2CV (v3.11)63 and OncodriveCLUSTL (v1.1.1)64. Collectively, these tools (with default parameters) identified 39 driver genes in our cohort that overlapped with entries in the COSMIC Cancer Gene Census (v101, GRCh37). These catalogues (Supplementary Tables 5 and 6) represent candidate drivers identified through computational approaches and were not functionally validated in this study.Chromosomal instability signaturesWe used the ‘Signature Discovery’ tool from the CIN compendium package44 to identify de novo CIN signatures in our cohort, following default parameters as specified in the software documentation.Mutation timingMutationTimeR (v1.00.2)65 in R (v4.3.0) with default parameters, except for bootstrap of 200, was used to time the SNVs and small indels with the help of copy number data (Supplementary Note 1.10).Clustered mutation analysisTo detect the clustered mutations in our cohorts we ran SigProfilerClusters (v1.0.11; default parameters with the exception of number of simulations set to 100)66 on the genomes in the low-burden subset. Hypermutant tumours were excluded because the vast number of mutations in these tumours will inevitably increase the number of false positive clusters. SigProfilerClusters divides the SBS mutations into clustered and non-clustered mutations before further categorizing the clustered events into three major classes: (1) class 1 or small clustered events including doublet-base substitutions (DBS; class 1a), multibase substitutions (MBS; class 1b), and Omikli (class 1c); (2) class 2 or larger clustered events also known as Kataegis; and (3) class 3, including any clustered event not assigned to the previous two classes. Given the relative sparsity of clustered mutations, we used thresholds of 25 and 15 mutations per sample for Omikli and Kataegis events, respectively (Supplementary Note 1.11).Machine learning analysisWe developed an ensemble learning approach using four well-known machine learning algorithms: random forest, logistic regression, XGBoost and CatBoost. This soft-voting classifier was applied to the SBS96, SBS288 and SBS1536 mutational contexts. The implementation was done using the scikit-learn (v1.3.0)67 package in Python. We used the Shapley additive explanations (SHAP v0.46.0)68 to calculate feature importance values. SHAP is a game theory-inspired approach that is designed to extract the marginal contribution of a feature to the overall prediction. The final output of SHAP is a matrix with the same shape as the input, representing how much each feature for each sample contributed to the prediction. Feature importance was determined by taking the mean absolute value of feature contribution values.Statistics and reproducibilityNo statistical method was used to predetermine sample size. The experiments were not randomized, and the investigators were not blinded to allocation during experiments and outcome assessment. Unless otherwise stated, all statistical tests were performed in Python (v3.11.6) and explained in Methods. The codes to run these tests are provided in the GitHub repository. The following Python libraries were used in this study: ipykernel (v6.25.2), ipython (v8.15.0), pandas (v2.1.0), numpy (v1.24.4), scipy (v1.11.2), matplotlib (v3.7.3), seaborn (v0.13.2), plotly (v5.16.1), kaleido (v 0.2.1), pywaffle (v1.1.0), xgboost (v1.7.6), catboost (v1.2.1), UpSetPlot (v0.9.0), nbformat (v5.10.4), patsy (v1.0.1), networkx (v3.4.2) and statsmodels (v0.14.4).Ethics statementThe Hospital for Sick Children Research Ethics Board provided ethical oversight.Reporting summaryFurther information on research design is available in the Nature Portfolio Reporting Summary linked to this article.
Prior therapy defines mutation profiles in childhood cancer at relapse - Nature
Chemotherapy, particularly with platinum-based drugs, is associated with substantial, rapidly detectable mutagenesis in childhood cancers, tripling private signatures and doubling mutation burden, highlighting therapy-induced tumour evolution and opportunities for safer, de-escalated treatment.
13,404 words~61 min read