Back to Articles
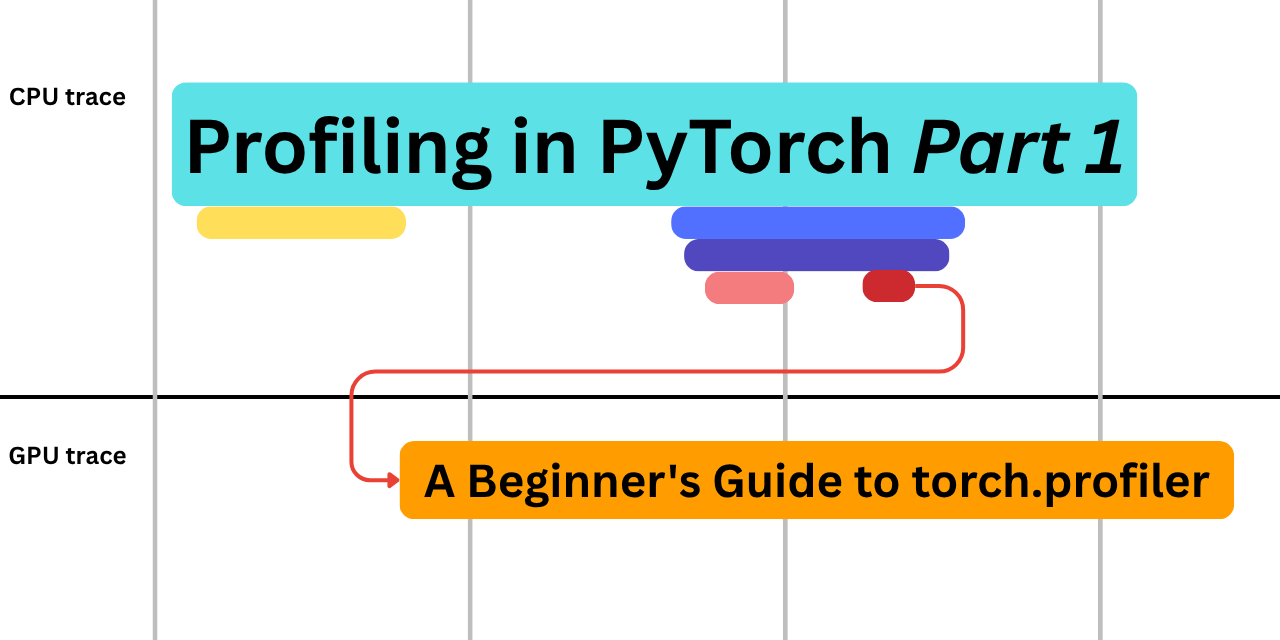
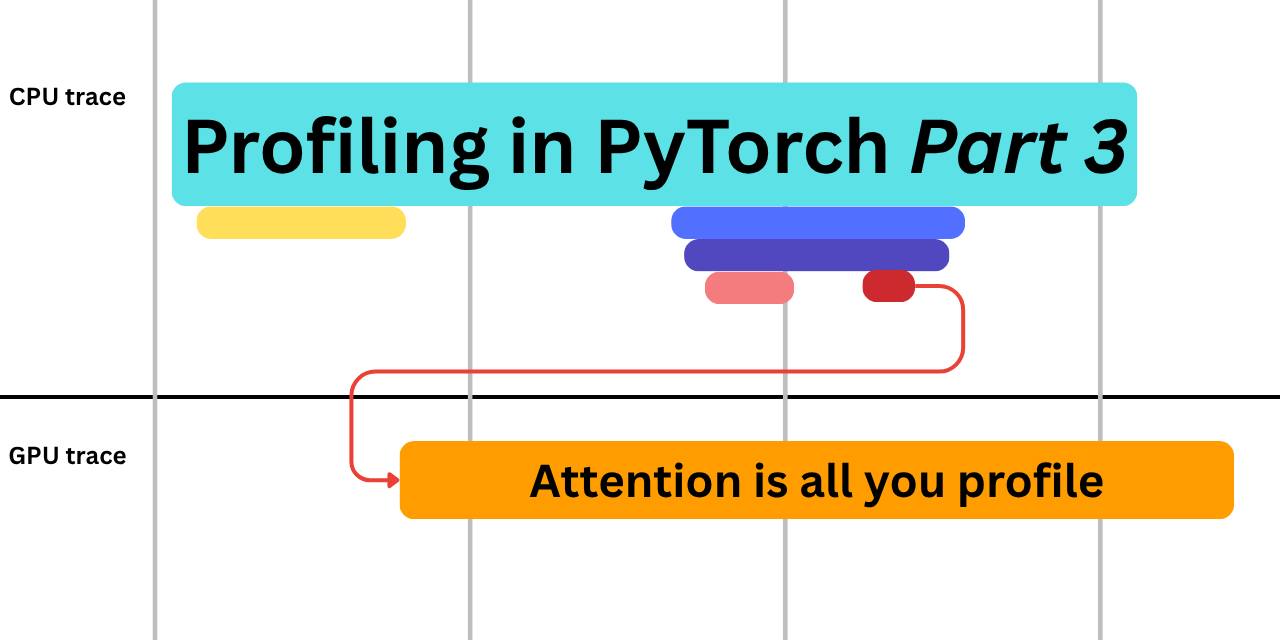
The series "Profiling in PyTorch" is meant to make you comfortable reading profiler traces and tables. In Part 1 we profiled basic math operations like addition and multiplication. We saw how the profiler table uncovers hotspots, and how the profiler trace shows the order in which an algorithm runs over time.
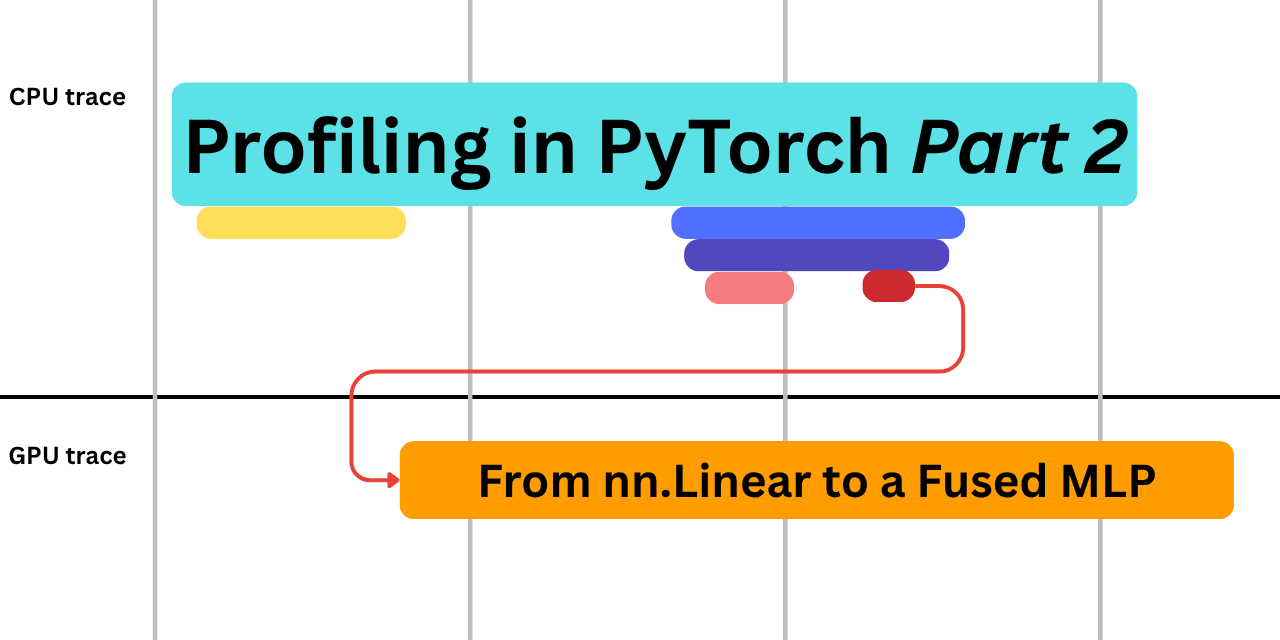
In Part 2 we wrapped that addition and multiplication into a torch linear layer. We then stacked several linear layers on top of each other (a multilayer perceptron) and profiled that. Along the way we also profiled fused and hand-tuned kernels.
From the perspective of the Transformer architecture, the next logical step for us to profile is yet another fundamental algorithm, attention. While being infamous for its quadratic-time complexity, many clever tricks exist to mitigate that issue and make it fast. Our goal here is not to cover every trick in detail. Instead, we want to see how each one looks different under the profiler.
The scripts for this blog post live here: 04_a_naive_attention.py, 04_b_inplace_ops_attention.py, 04_c_sdpa_attention.py, and 04_d_kernels_attention.py. Like before, it helps to open them in a separate tab and walk through the code as you read. We use an NVIDIA A100-SXM4-80GB GPU to run the scripts. It is really easy to set up a GPU on the Hugging Face infrastructure and experiment with the scripts using Dev Mode with Spaces. One could also run the scripts with the Hugging Face Jobs pipeline.