In standard web development, building a live analytics dashboard is relatively straightforward: you drop a JS tracker on the frontend, ingest the payload into a message broker like Kafka, and pipe it into a time-series database.
But what happens when you need to track physical humans in real life?
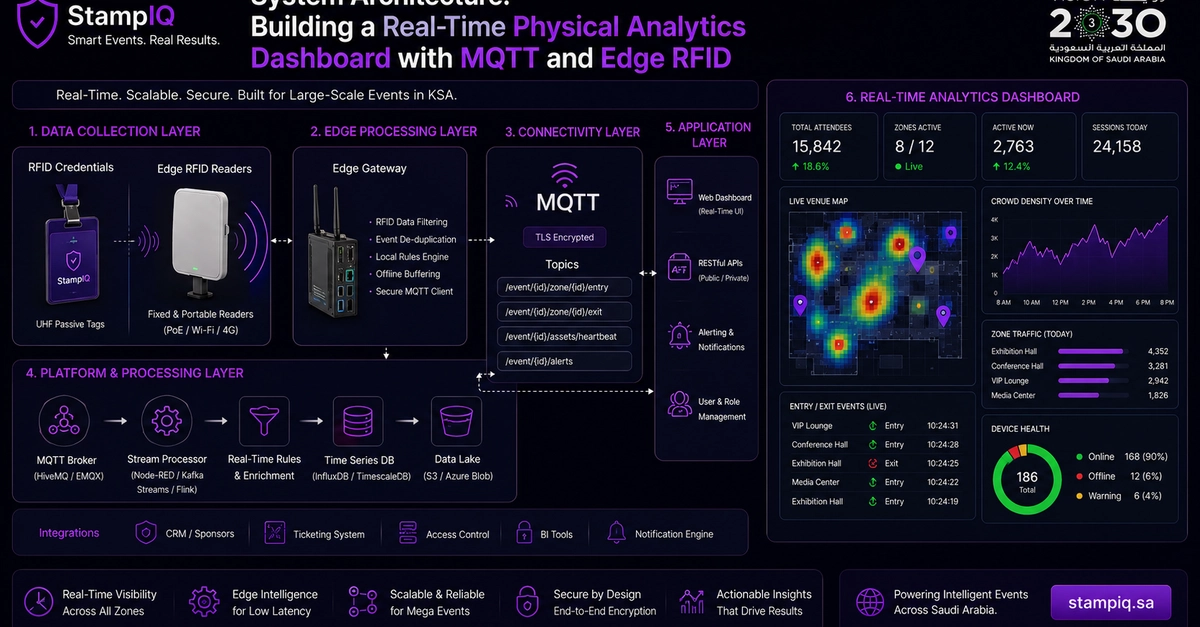
Recently, we were tasked with building the backend infrastructure for a massive 15,000-delegate B2B exhibition in Riyadh. The organizers came to us with a common industry problem, asking: "Where can I find an event reporting platform with live dashboards?"
They didn't just want post-event Excel sheets; they wanted sub-second live heatmaps of crowd density and instant sponsor ROI tracking. To achieve this, we had to ditch traditional optical barcode scanners and build a robust, edge-computed IoT pipeline.
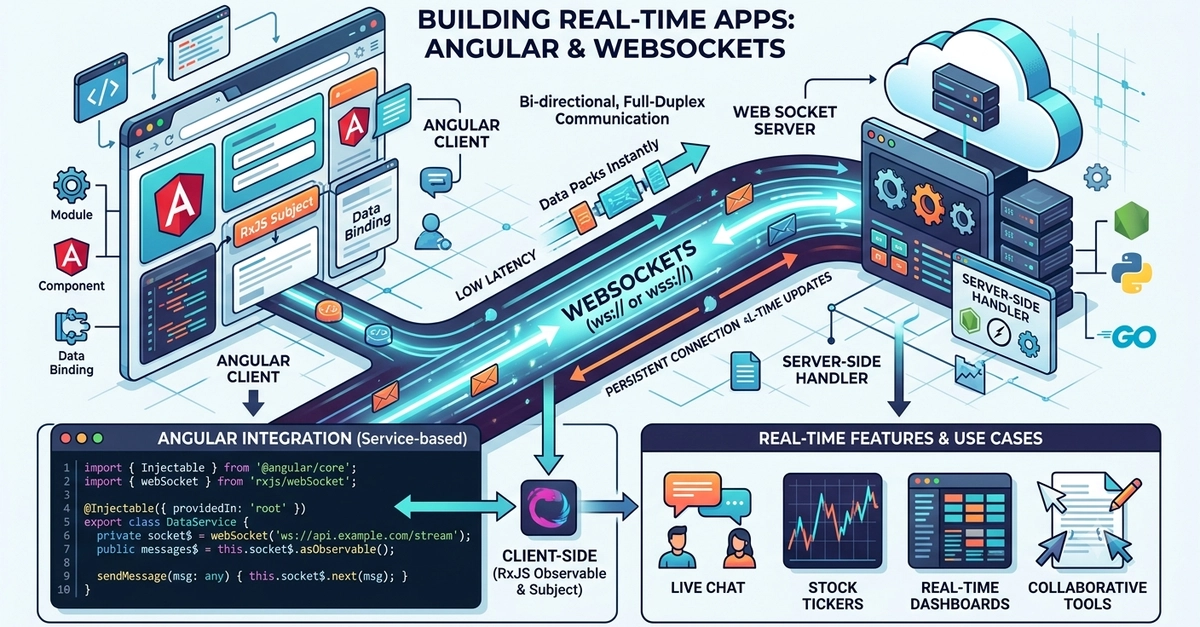
Here is the system architecture we used to build a live physical reporting platform.