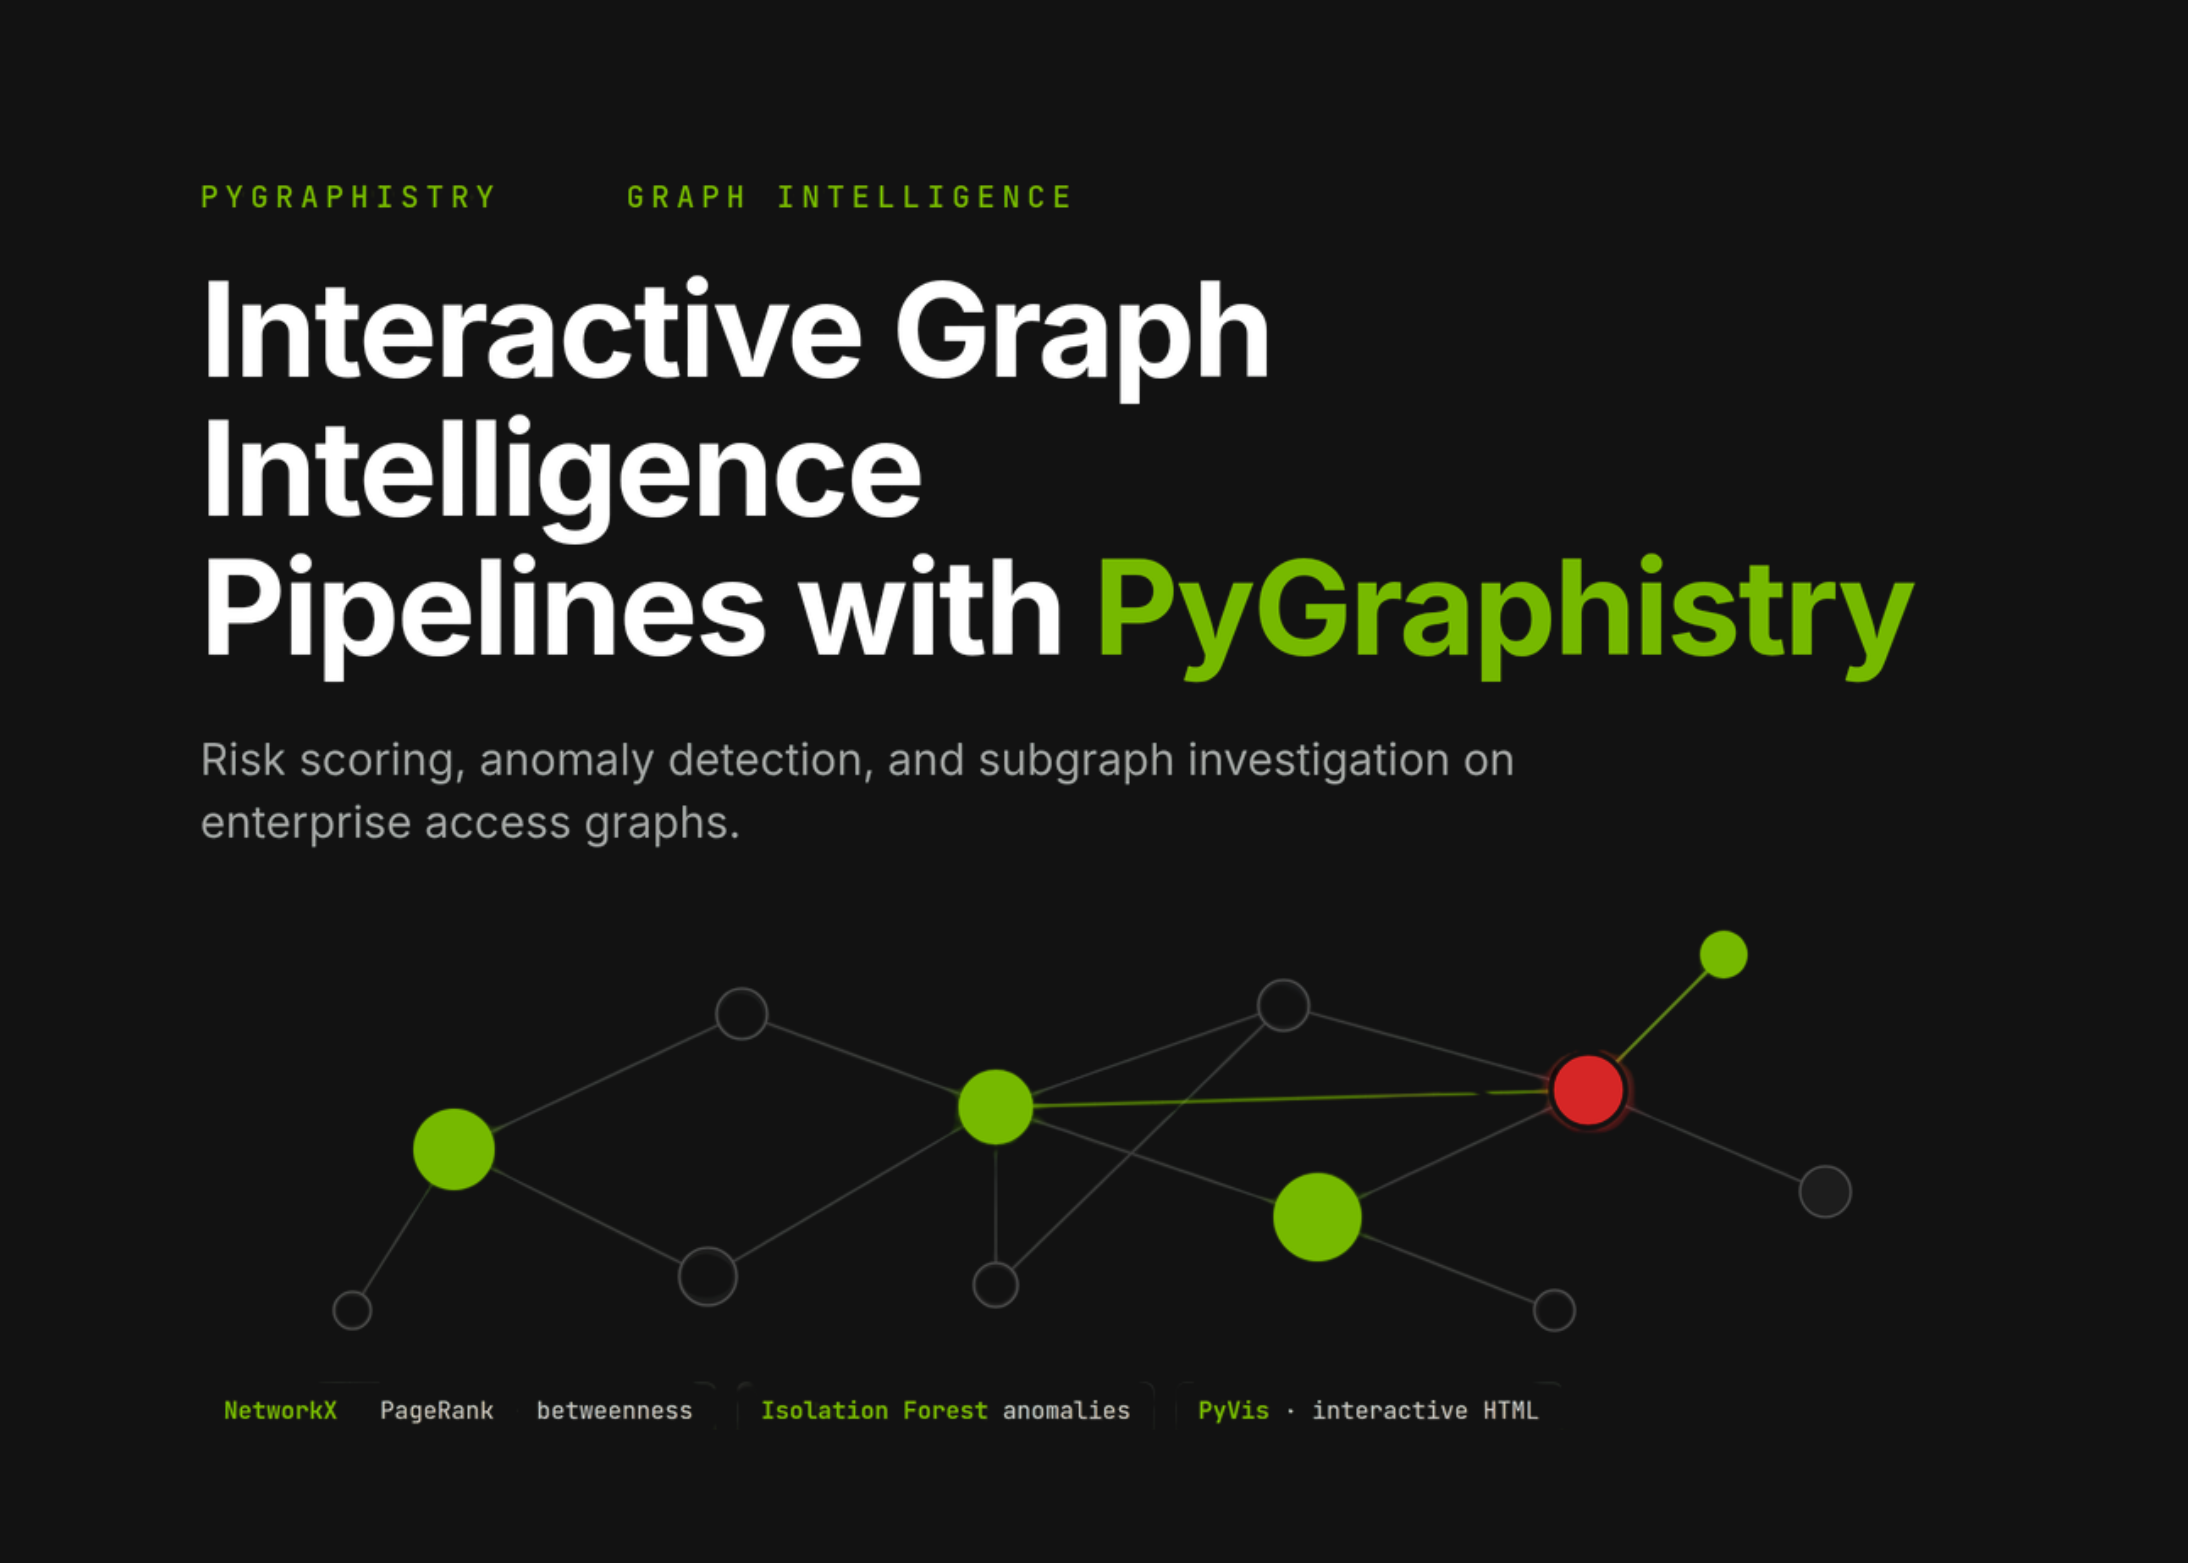
In this tutorial, we build an advanced, Colab-ready workflow around PyGraphistry for interactive graph analytics and visualization. We start by creating a realistic enterprise-style access dataset, transforming it into nodes and edges, and enriching the graph with risk scores, anomaly indicators, centrality metrics, community detection, and layout embeddings. We then use PyGraphistry to bind graph structure, visual encodings, labels, tooltips, and filtered subgraphs, and to generate local interactive visualizations when Graphistry credentials are not configured. Through this implementation, we see how graph intelligence helps us investigate suspicious users, risky devices, IP relationships, sensitive services, and high-risk behavioral patterns in a practical security analytics setting.
⭐⭐⭐⭐⭐ Star us on GitHub for future Code notebooks and implementation
Installing PyGraphistry and Dependencies
import os, sys, subprocess, warnings, textwrap, json, math, random
warnings.filterwarnings("ignore")