In financial environments where platform teams need to consolidate signals from dozens of AWS workloads into a unified observability backend — whether Datadog, Grafana Cloud, Honeycomb, or an internal stack — the CloudWatch → OpenTelemetry bridge pattern appears as the obvious solution. But 'obvious' and 'correct' rarely coincide in architecture. This pattern has a specific anatomy, a narrow validity envelope, and failure modes that only surface in production under real load. I'm going to dissect every layer.
The Real Problem: Observability Fragmentation in AWS-Native Environments
Every organization that grows beyond two or three engineering teams faces the same tension: AWS services emit metrics natively to CloudWatch — Lambda, RDS, EKS, API Gateway, MSK — but the corporate observability backend speaks OTLP. The result is a split world: SREs need to open two consoles to correlate an incident, alerts live in different namespaces, and business dashboards become impossible to build without manual ETL.
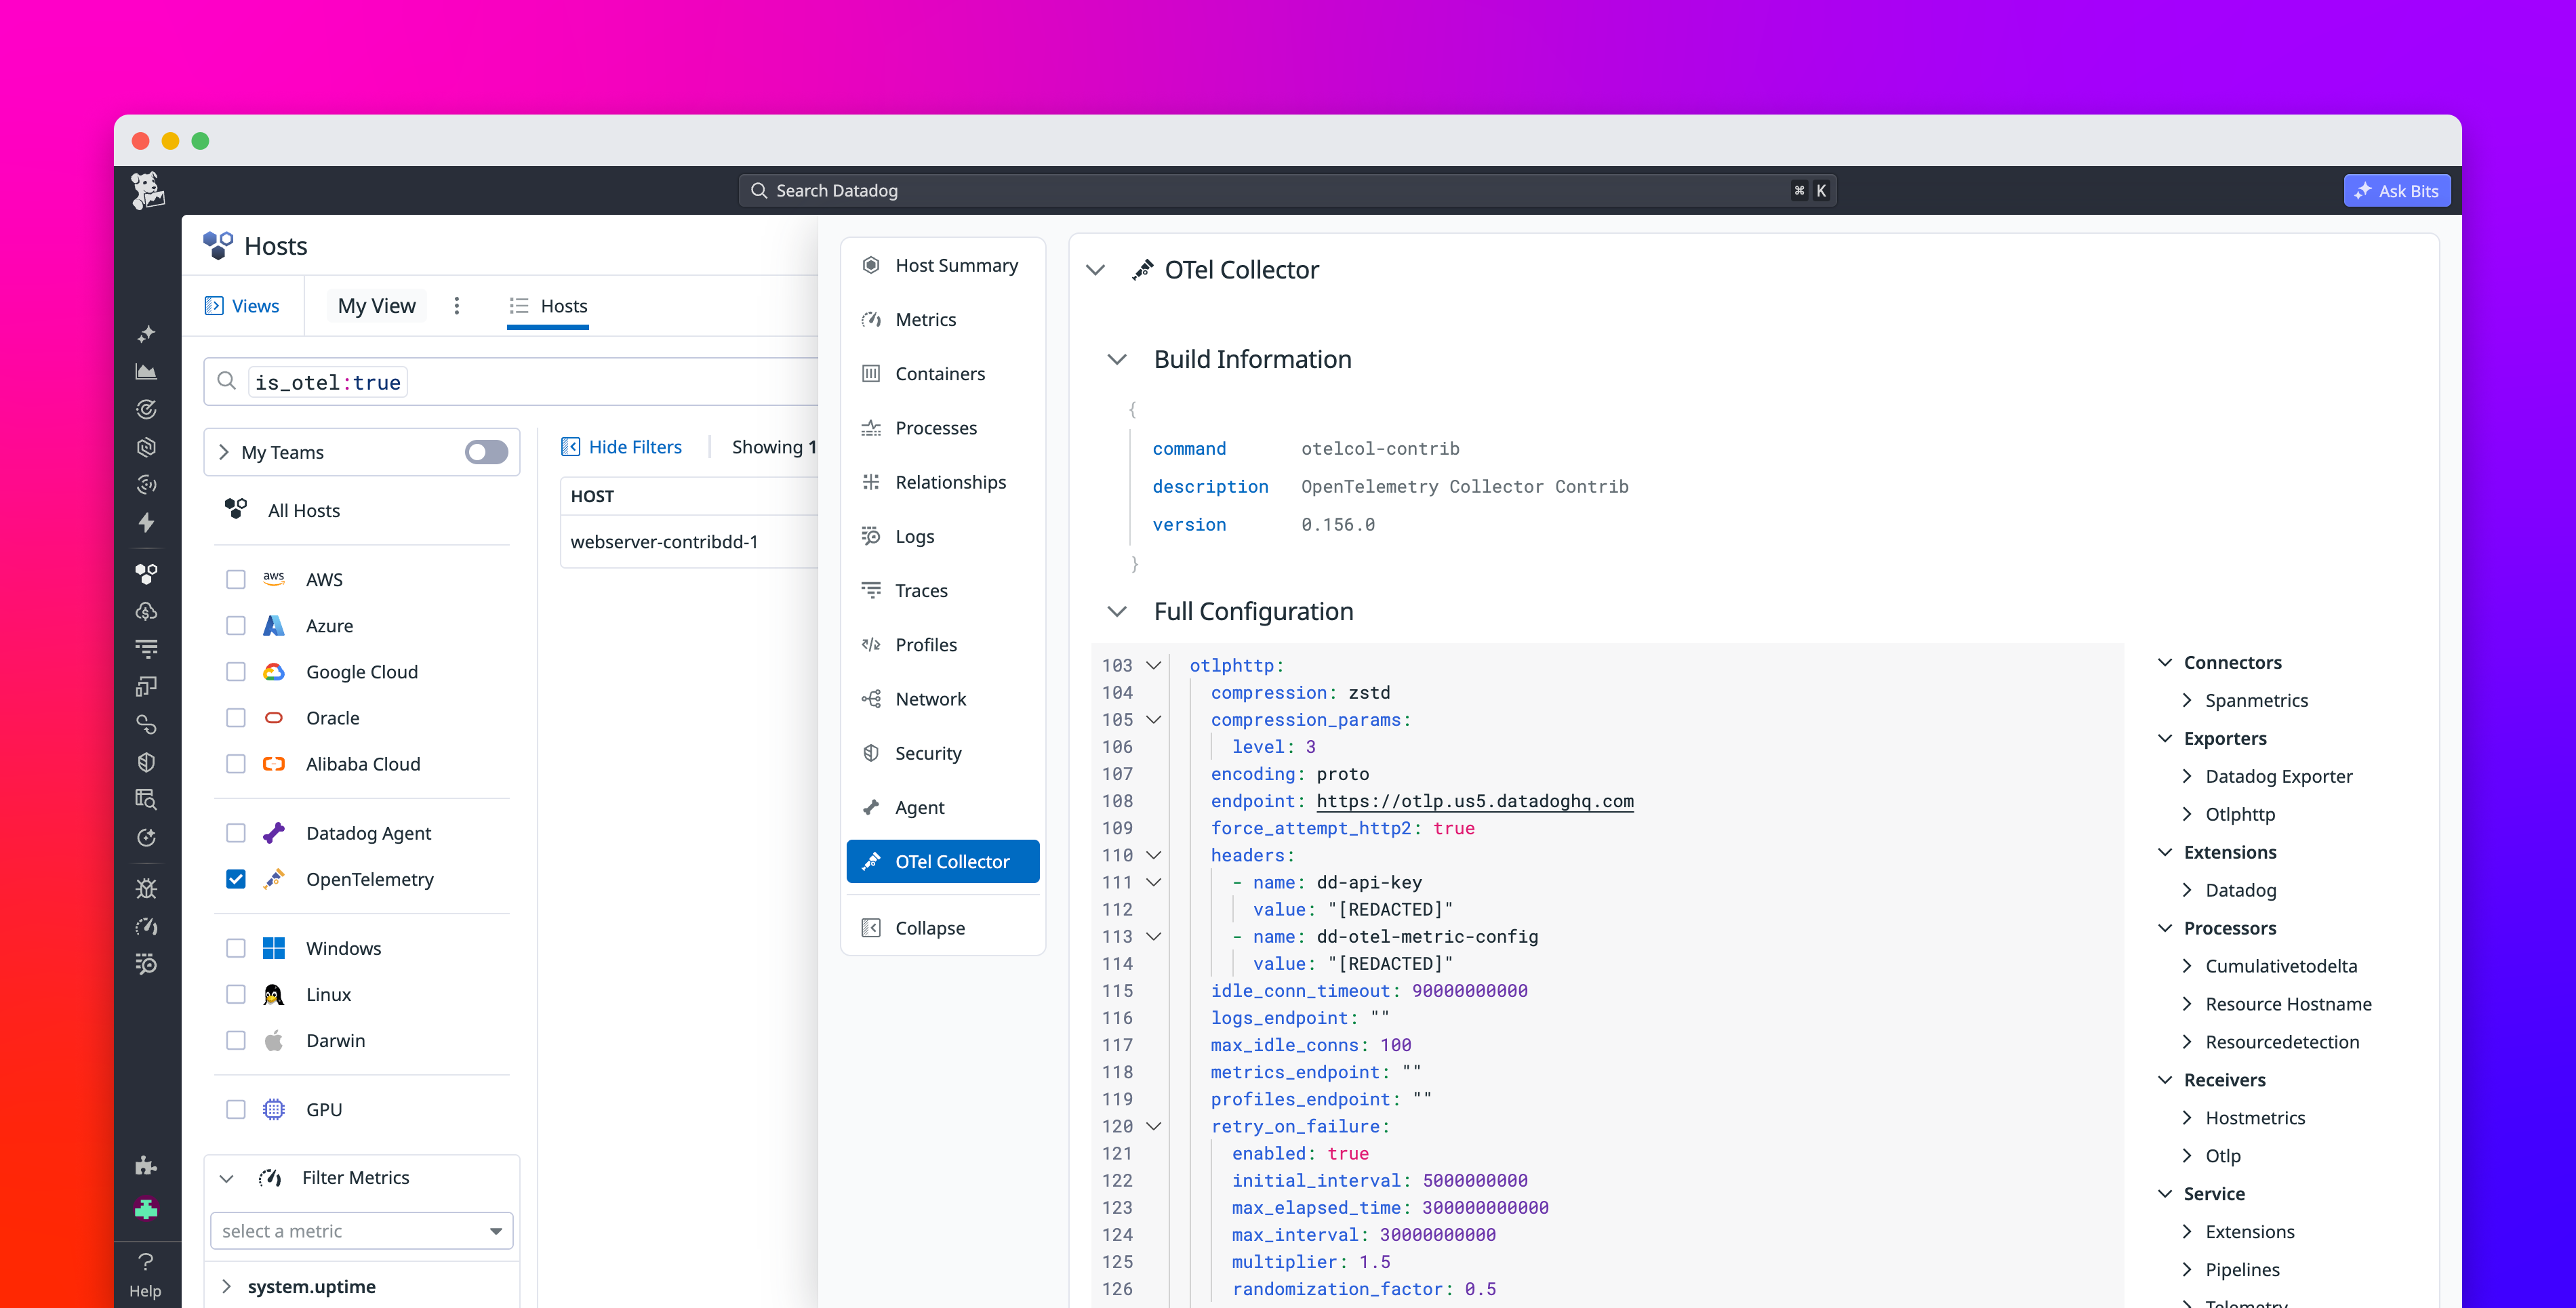
The bridge pattern exists to solve exactly this. The core idea is simple: a Lambda function (or an OTel collector running on ECS/EKS) subscribes to CloudWatch metric streams via CloudWatch Metric Streams or polls the GetMetricData API, transforms the payload to OTLP format, and forwards it to a collector endpoint. In theory, you get a single observability control plane. In practice, the complexity hides in the details.