Originally published on lavkesh.com
I've found that Kubernetes observability is a unique beast, different from monitoring your application, you're dealing with infrastructure, workloads, and the cluster itself, but fortunately the tooling has come a long way so you don't have to start from scratch
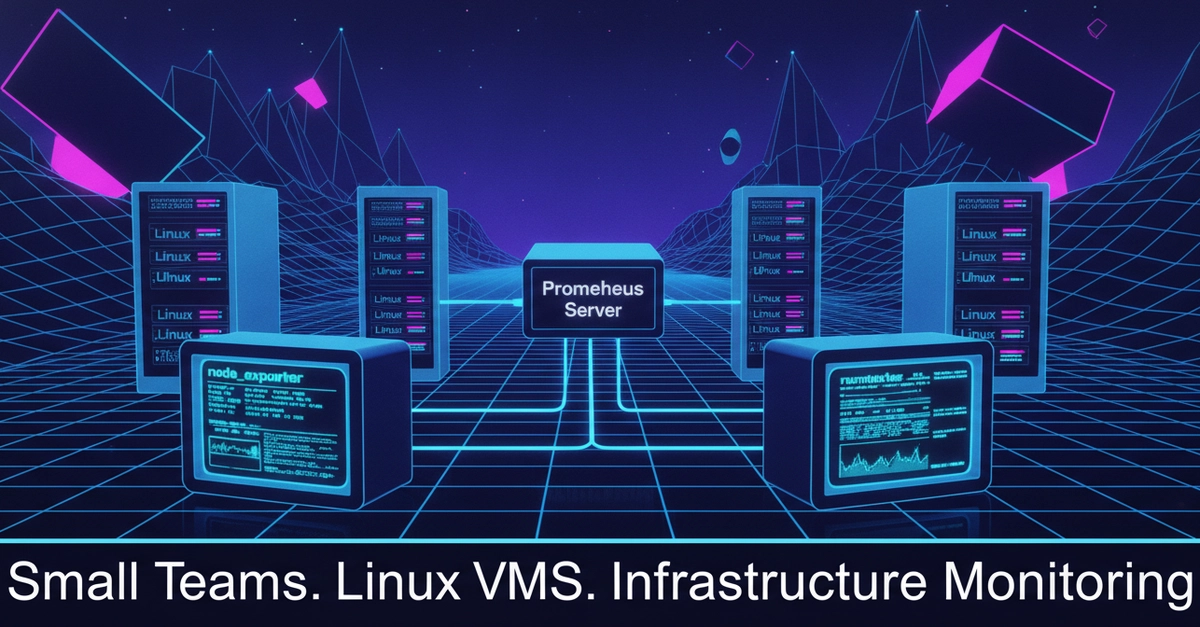
Prometheus is the de facto standard for Kubernetes, its pull model fits naturally with Kubernetes service discovery, you add annotations and Prometheus automatically finds your pods, no manual configuration needed, and with kube-state-metrics and Node Exporter you get a solid foundation for cluster state and host metrics
I ran the Prometheus Operator in a 200‑node cluster with about 4 000 pods and quickly learned that the default scrape interval of 15 seconds was eating more than a gigabyte of RAM on the server. Tightening the interval to 30 seconds for low‑frequency services and using relabel rules to drop unused metrics cut the memory footprint in half. Adding a Thanos sidecar let us ship raw blocks to S3 and keep a 30‑day retention without blowing local disks, but the extra network traffic meant we had to provision a dedicated bandwidth slice or risk back‑pressure on the scrape jobs.
Grafana builds on top of Prometheus, Loki, and Tempo, providing dashboards, alerting, and multi-source queries, the community has already done some of the work for you with pre-built Kubernetes dashboards on grafana.com/dashboards, start with those and customize them to fit your team's needs