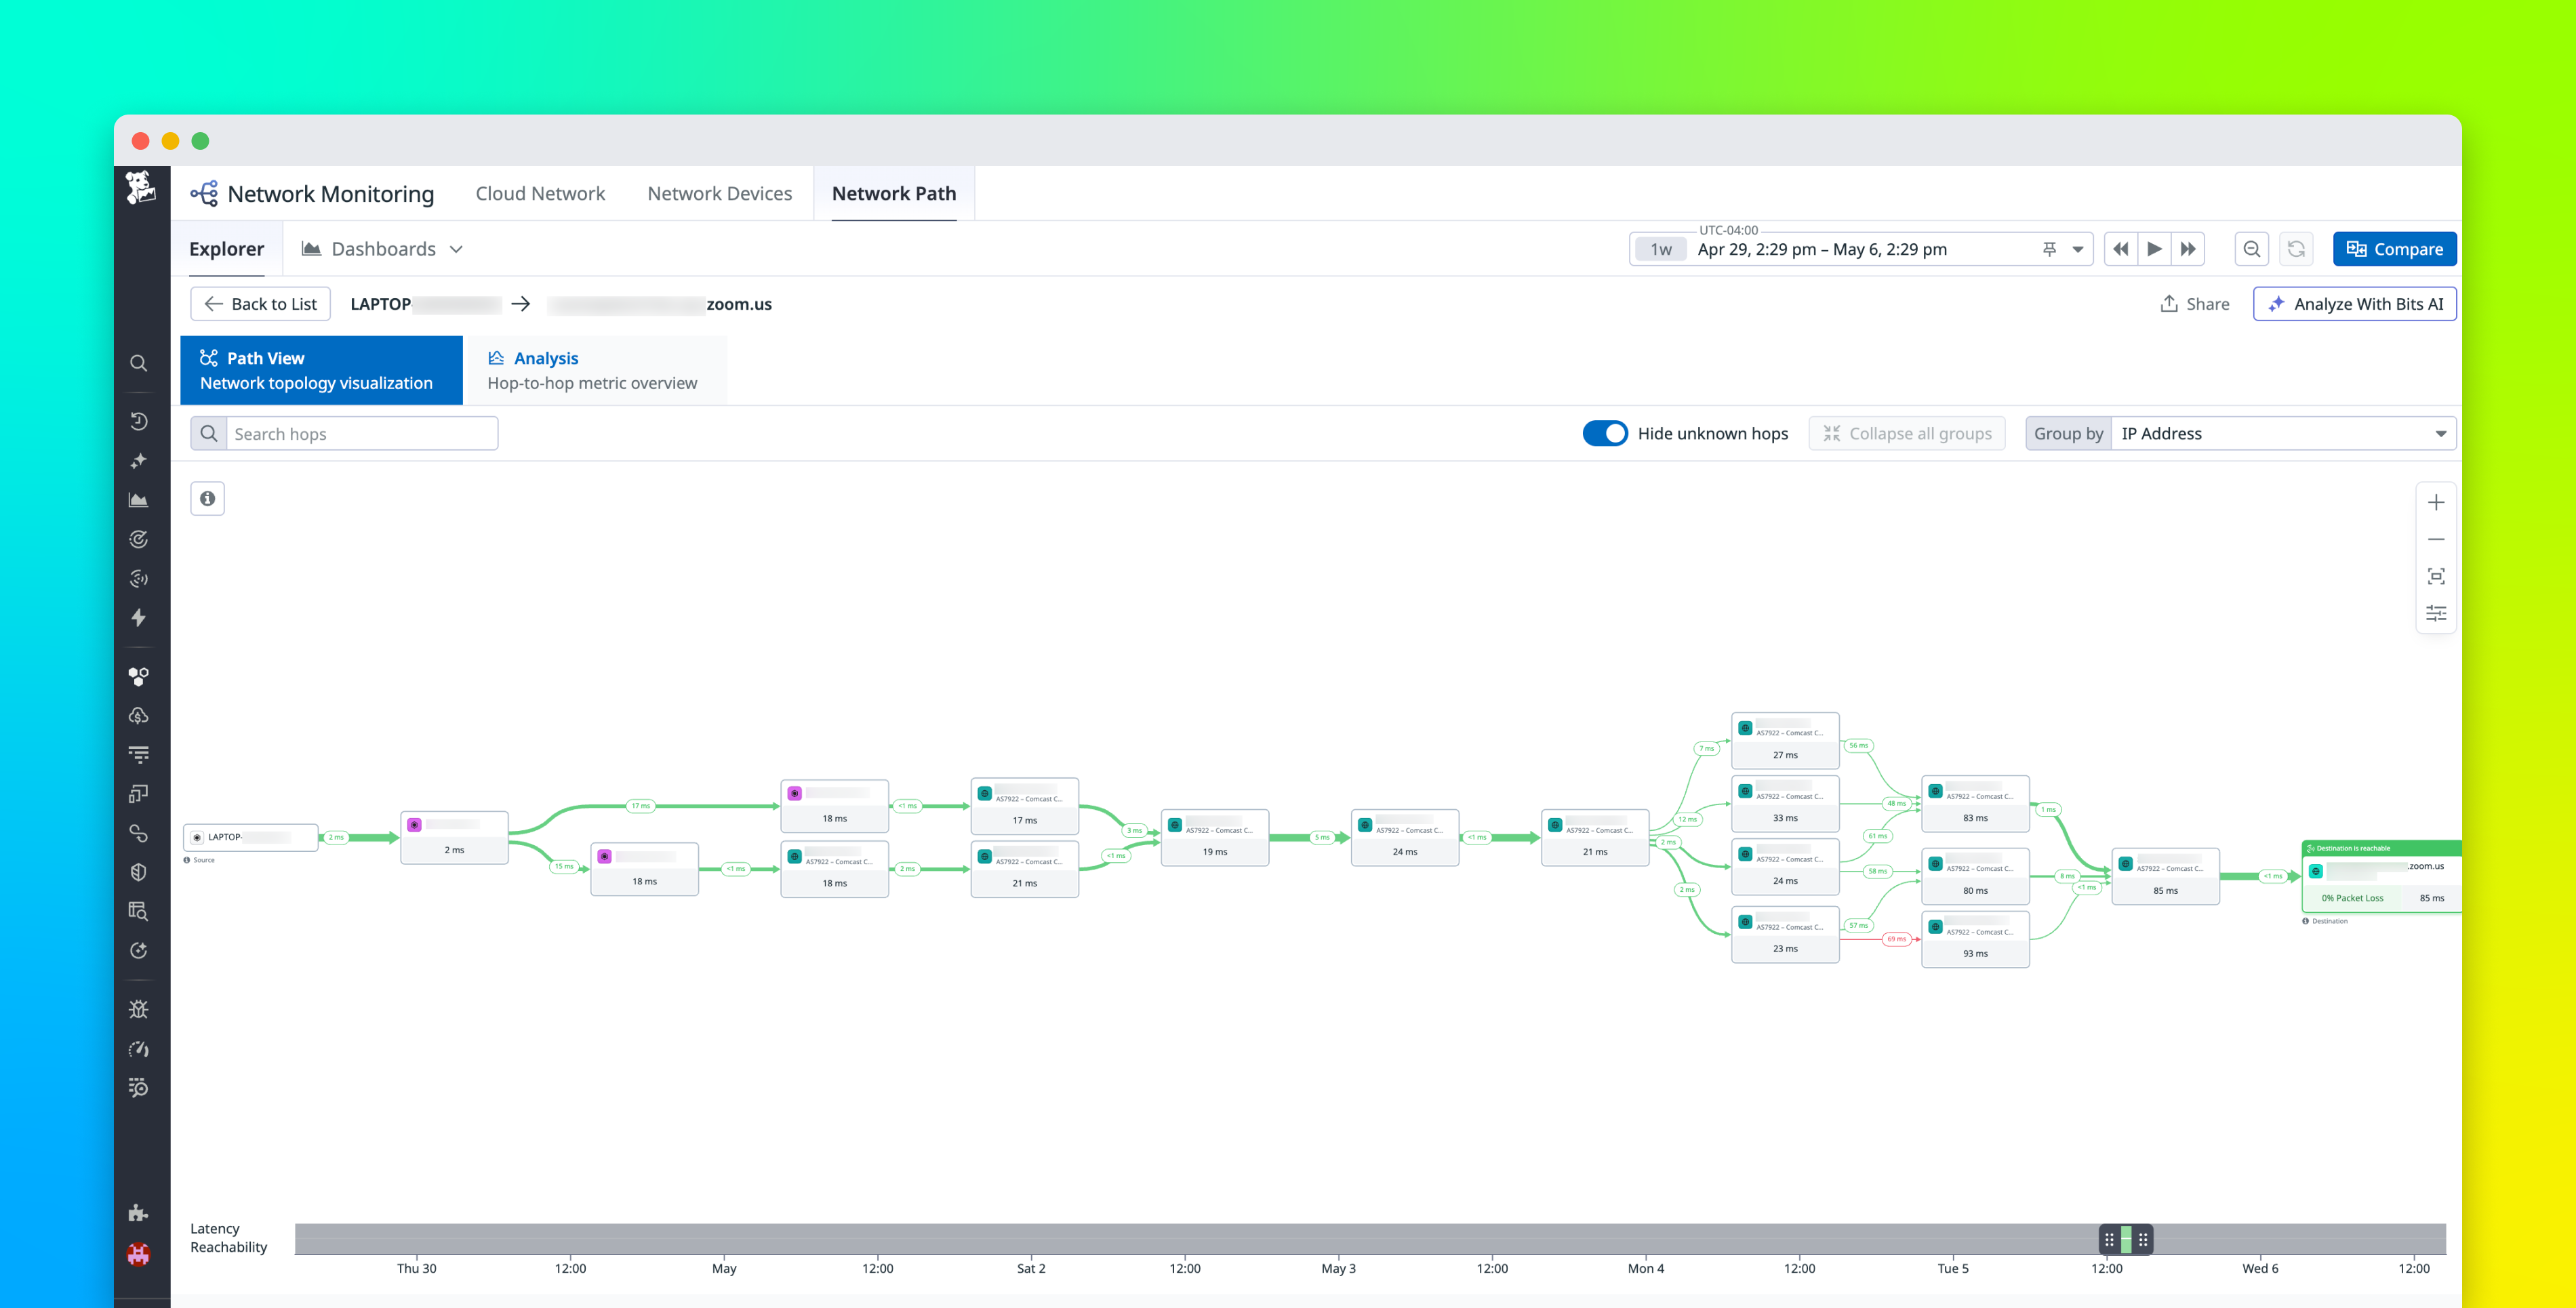
When a critical application starts throwing latency alerts, the network is often one of the hardest places to investigate. Application teams can see latency in traces and service dashboards, while network teams often need to inspect device metrics, traceroutes, NetFlow data, and configuration changes in separate tools. This separation slows investigations because teams have to determine whether the issue came from a degraded device, congested path, misrouted connection, or recent configuration change before they can decide what to fix.
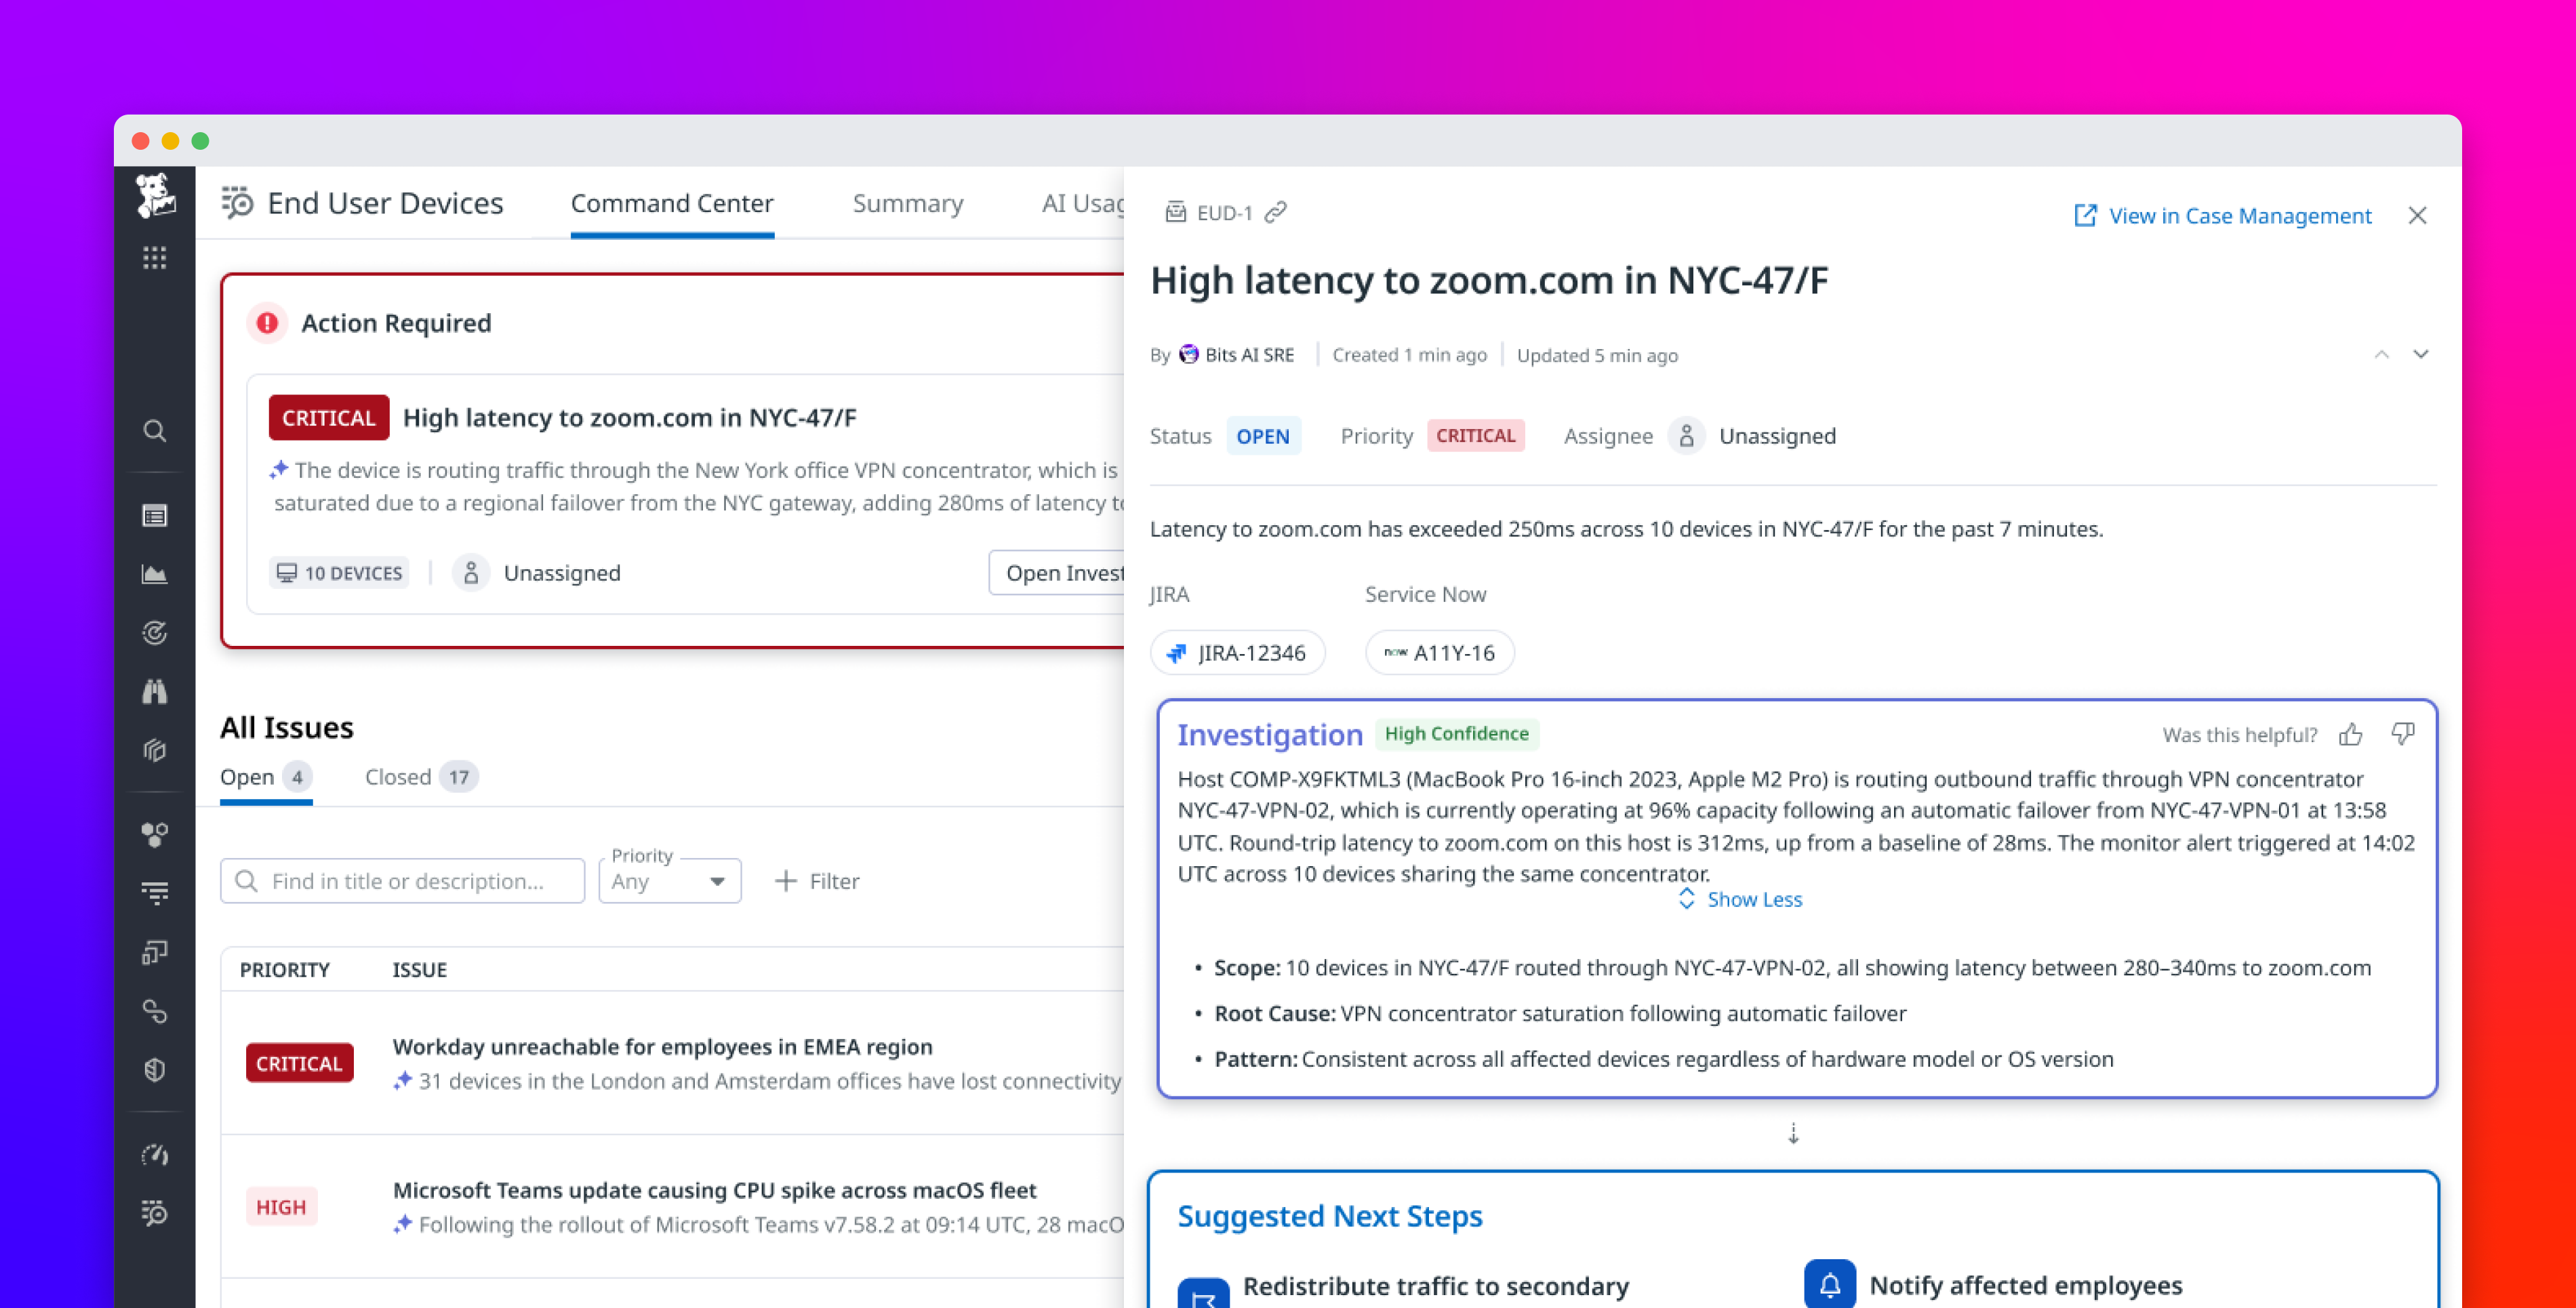
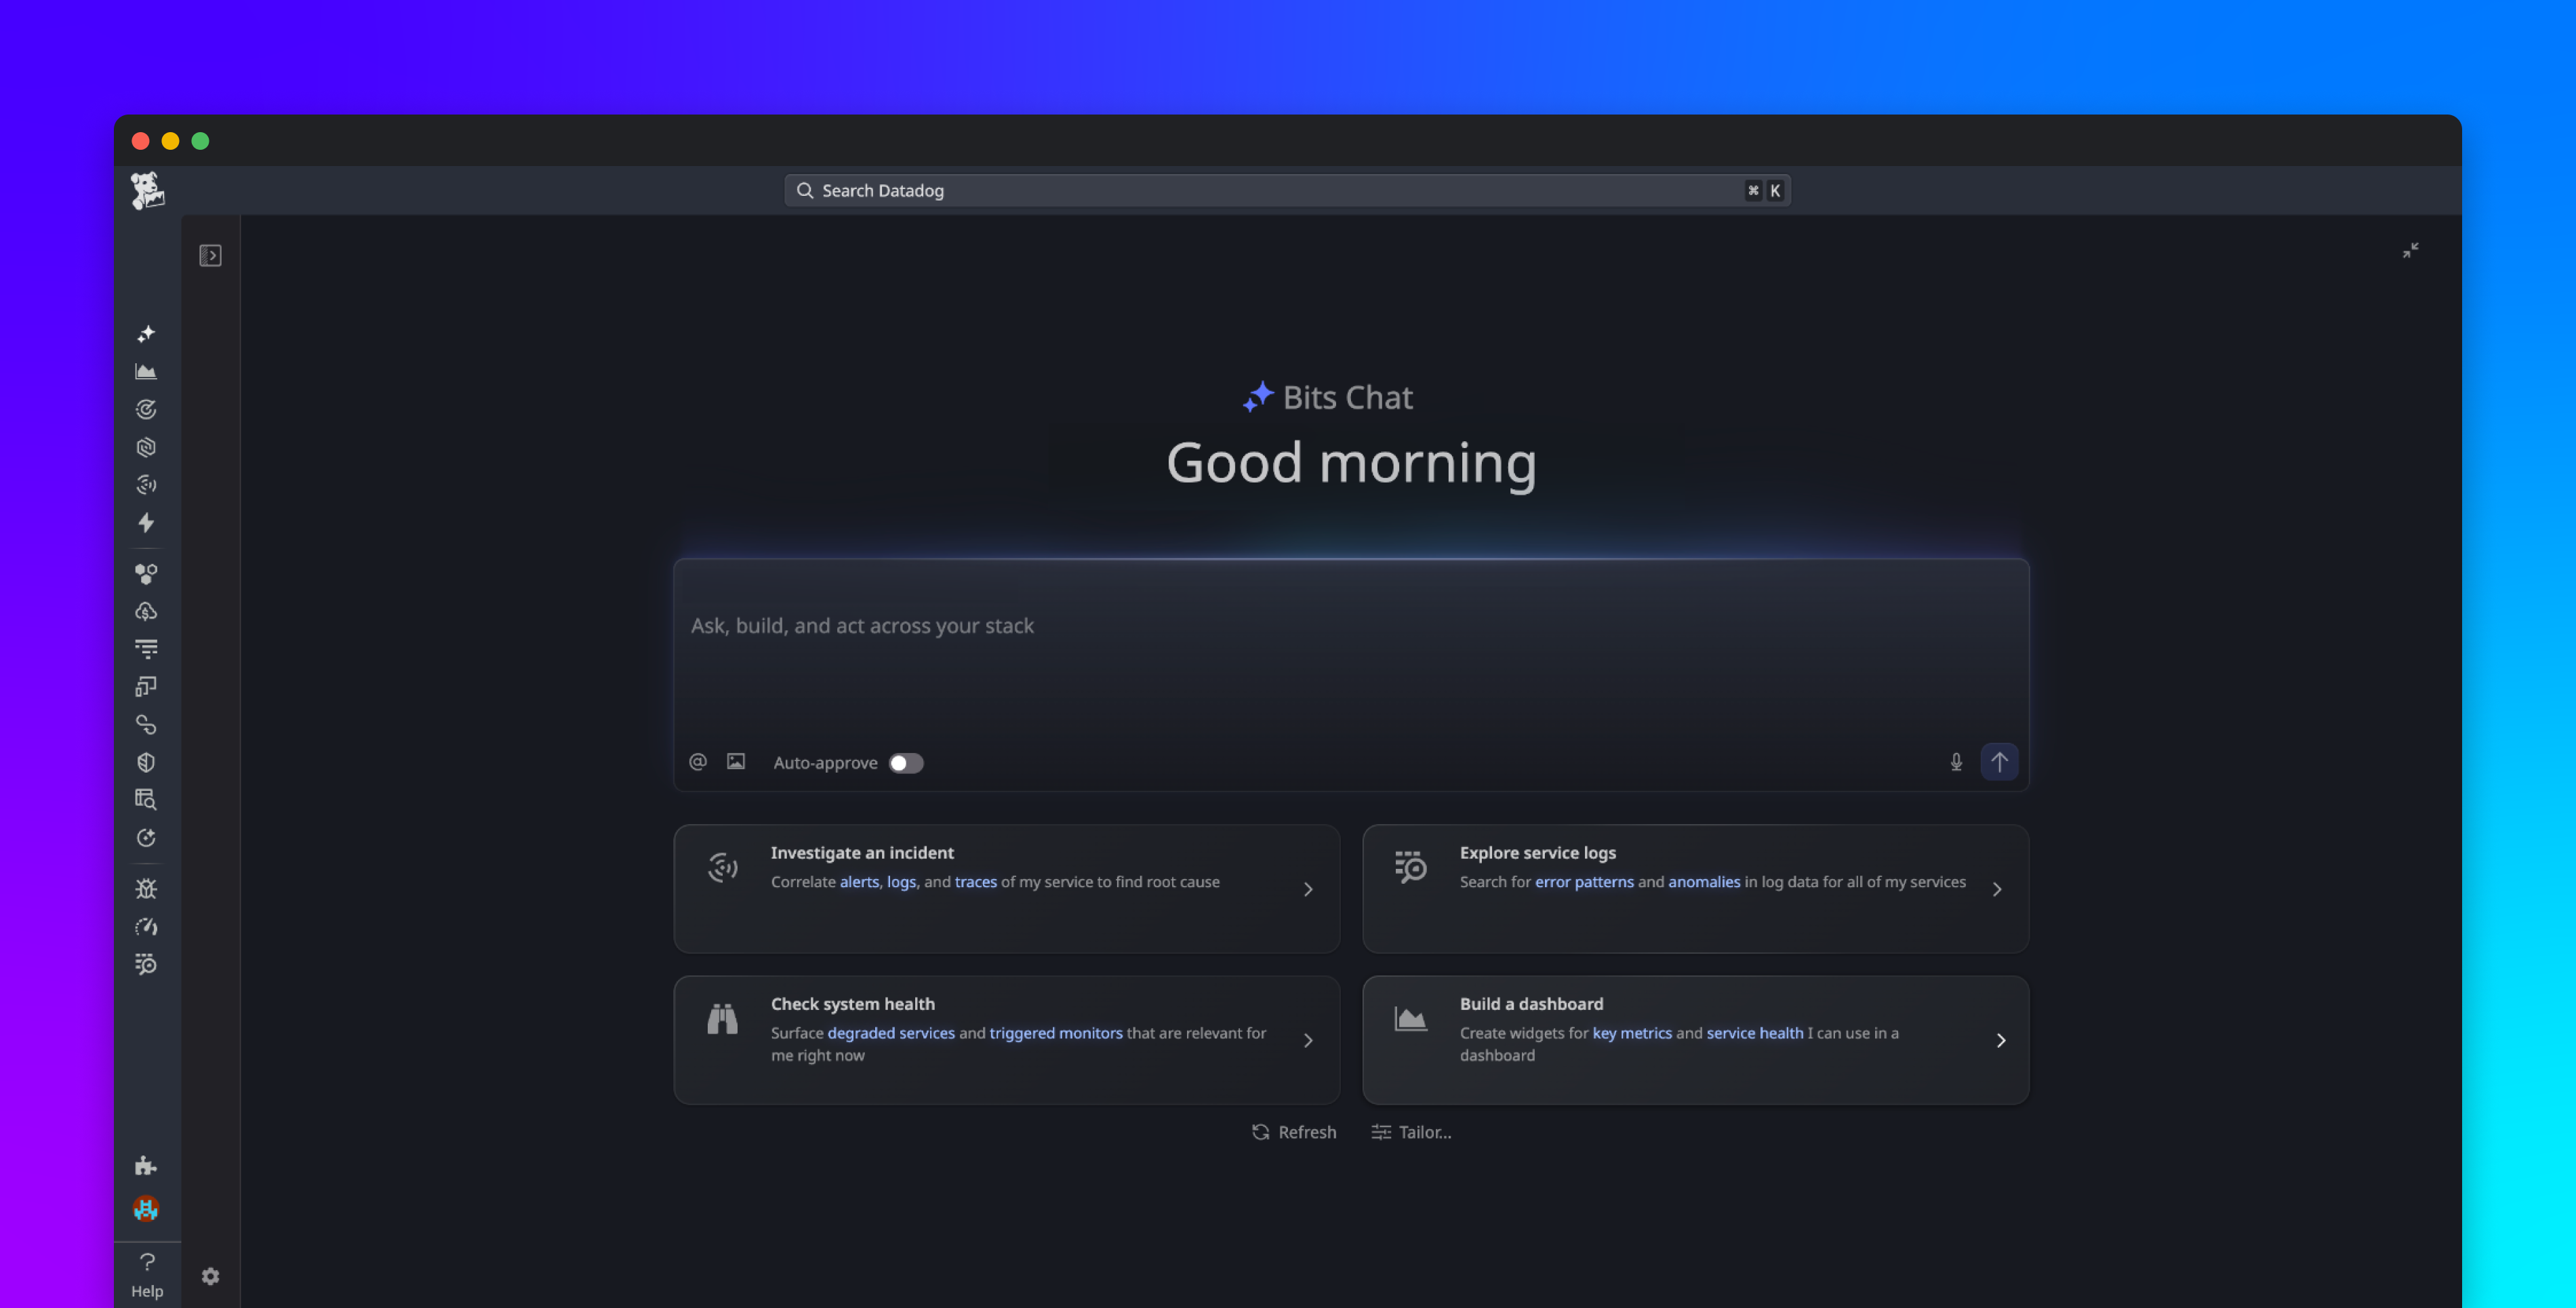
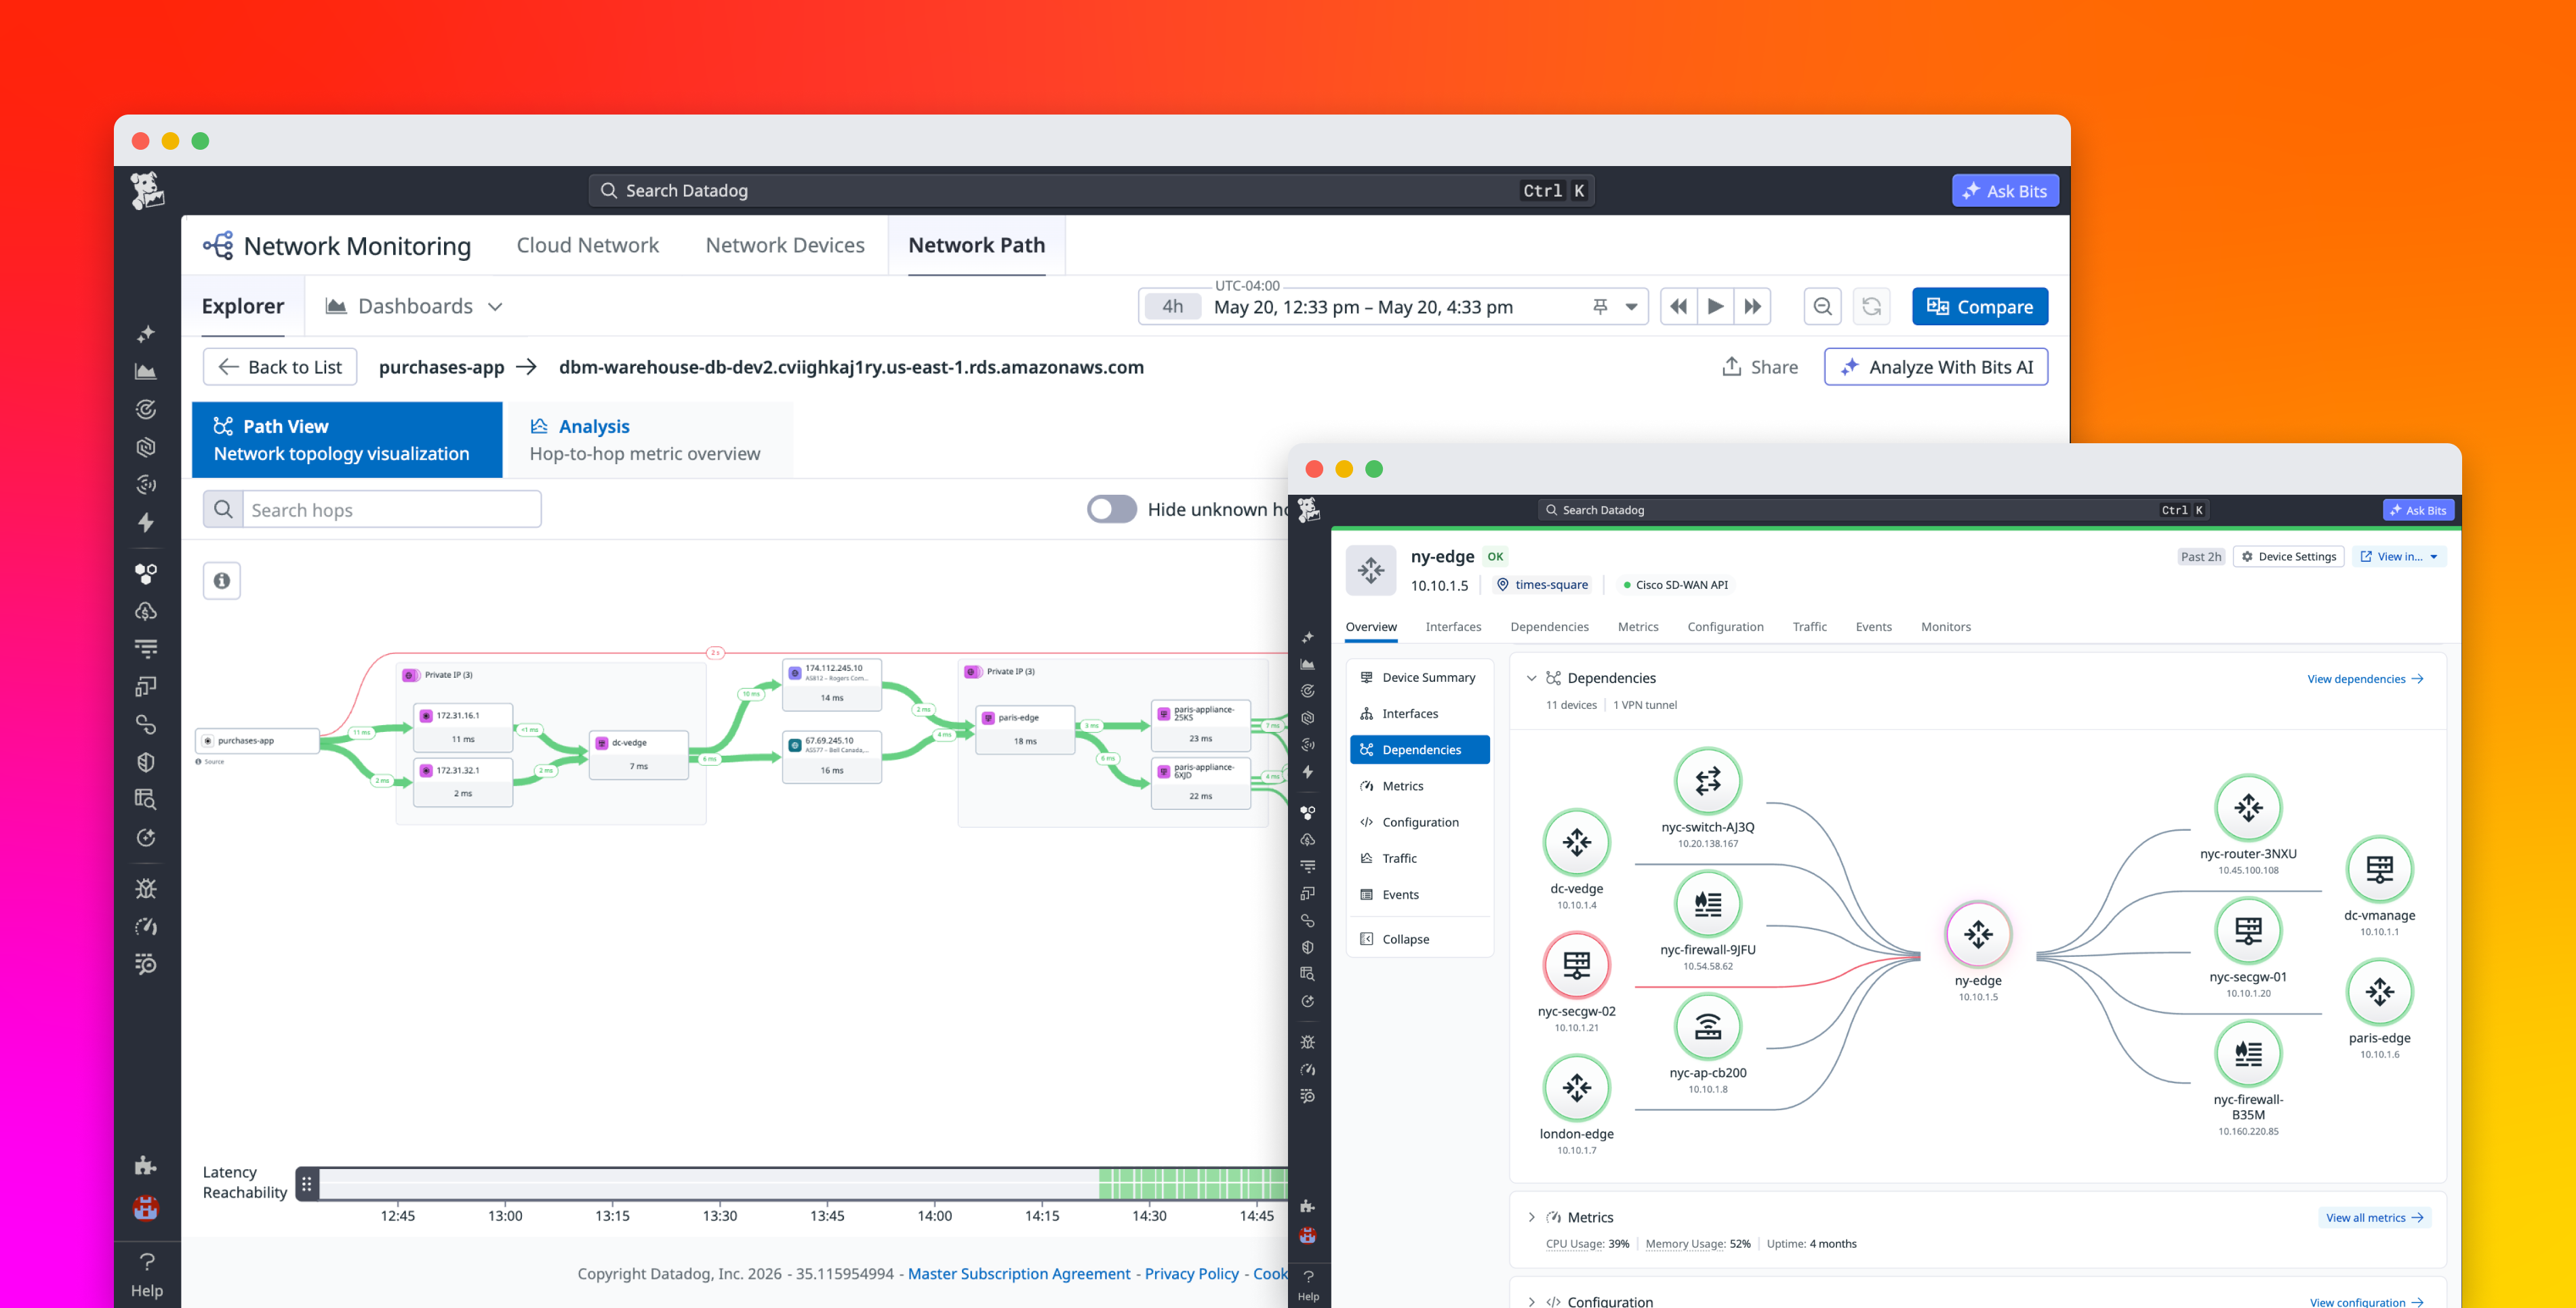
Datadog Network Monitoring brings application teams, SREs, and network specialists into the same workflow. New capabilities connect application issues to the specific device or hop responsible and let any engineer act on the fix. From an APM trace or an alert, you can pivot down the stack from L7 to L1 to a Network Path comparison view to spot the hop that changed, drill into a Network Device Monitoring (NDM) view that surfaces device-level anomalies and configuration changes side by side, surface the associated configuration change in Network Configuration Management (NCM), and ask Bits Chat to translate the findings into plain English. When the root cause is a recent configuration change, you can roll it back from the same view, without leaving Datadog.