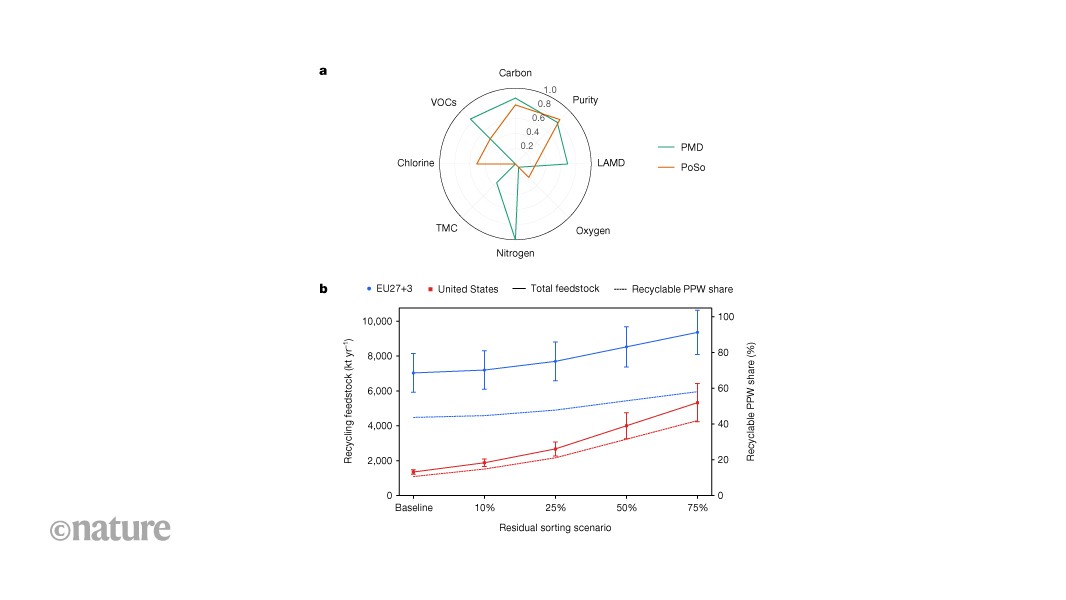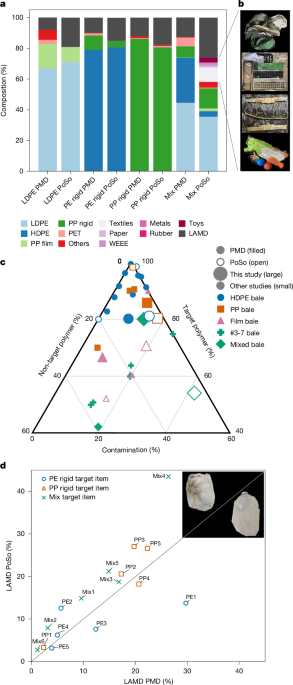
MainGlobal plastic production exceeded 413.8 Mt in 202412, but only about 9% is recycled13. Collection and sorting remain key bottlenecks1, driven by low collection-system efficacy3,14, public non-compliance and limitations of material recovery facilities (MRFs). As a result, up to 65% of European plastic packaging waste (PPW) is diverted to mixed residual streams comprising both recyclable and non-recyclable plastic packaging4,5.Collection and sorting strategies vary widely. In source-separation systems, households separate recyclables, typically as multi-material stream (for example, plastic packaging, metals and drinking cartons (PMD)) or via single- or dual-stream systems. In contrast, mixed-waste systems collect all waste together and depend on downstream post-sorting. Globally, plastic recycling still relies on mixed waste collection followed by post-sorting (PoSo), ranging from informal recovery to mixed-waste MRFs15, often achieving recycling rates below 15% in countries such as China16, Brazil17 and Australia18. In the USA, multiple collection systems coexist, but often target only polyethylene terephthalate (PET) bottles and high-density polyethylene (HDPE) containers, contributing to similarly low overall plastic recycling rates (<15%)19,20.By contrast, countries with established source-separation systems, for example, Belgium, the Netherlands and Germany, achieve collection rates above 70% (refs. 3,14) and recycling rates above 50%. However, even these systems retain 7–30% non-target material in PMD streams owing to household misplacement21,22, and losses during sorting and processing create a gap between collection and recycling rates.These limitations, combined with advances in post-sorting technologies, raise the question of whether post-sorting, or hybrid approaches, could outperform source separation6,7. Although discussions often prioritize recycling volumes, recyclate quality is critical for substituting virgin materials23. Here ‘recyclate quality’ refers to the expected mechanical and technical properties determining functionality in end-market products. As this concept is context dependent24,25,26,27, it is not measured but inferred from feedstock quality indicators.Post-sorting processes heterogeneous streams, including non-packaging plastics, potentially increasing contamination and reinforcing the quantity–quality trade-off3. Although feedstock heterogeneity is known to limit recyclate quality3,28, comparative analyses across collection systems remain scarce7,29. A previous study8 showed only minor differences in low-density polyethylene (LDPE) and polypropylene (PP) and none in HDPE between source-separated and post-sorted bales, including after washing. However, recyclate quality extends beyond polymer composition and mechanical properties, factors such as level of attached moisture and dirt (LAMD), volatile organic compounds (VOCs) and trace contaminants (metals, halogens) remain insufficiently characterized despite their effects on recyclate quality11,23,28,30 and their relevance for mechanical and chemical recycling31,32,33.The debate between source separation and post-sorting remains polarized, with limited quantitative evidence on quantity–quality trade-offs. This study addresses this gap with a comprehensive dataset on polyolefin-rich waste streams, that is, about 60% of global plastic waste. We investigate whether post-sorting can deliver high-quality bales, whether residual waste plastics are more contaminated and odorous, and the quantitative effects of post-sorting on available recycling feedstock.These questions were examined through an extensive sampling campaign in the Netherlands, using a single industrial-scale facility processing both source-separated and post-sorted streams on the same sorting line, but at different times, enabling controlled comparison under consistent conditions (Extended Data Tables 1 and 2).Similar bale purity across streamsWhen bale purity is defined on a dry-weight basis as the proportion of target polymer within a sorted bale (for example, PP content in a PP bale), source-separated (PMD) and post-sorted (PoSo) samples show comparable target polyolefin content: LDPE bales contained 67.0 ± 18.0 wt% and 71.1 ± 6.7 wt% polyethylene (PE), PE rigids contained 79.1 ± 3.3 wt% and 80.6 ± 35 wt% PE, and PP rigids contained 85.9 ± 1.4 wt% and 80.3 ± 1.5 wt% PP, respectively (Fig. 1a and Supplementary Information section 3.1).Fig. 1: Polymer composition and LAMD.The alternative text for this image may have been generated using AI.Full size imagea, Dry-weight polymer composition and associated LAMD of sorted plastic waste bales. Polymer fractions are reported in wt% (dry basis) for LDPE, PE rigid, PP rigid and mixed plastic bales collected from source-separated (PMD) and post-sorting (PoSo) systems. ‘Others’ includes all other polymer types, for example, polystyrene, PVC and polyamide. The mix PoSo composition combines data from identification of polymer fraction through Fourier transform infrared spectroscopy and non-packaging fraction (textiles, paper, WEEE, metals, rubber, toys) through visual inspection. Non-packaging fraction sums up to 15.7 wt% of the total mix PoSo sample. b, Examples of non-packaging plastic items included in the sorted mixed plastic bale (from top to bottom): textiles (shoes, heavy-duty cloths), WEEE (console), metals and toys. c, Ternary plot comparing bale composition by target polymer (right axis; 40–100%), non-target polymer (left axis, 0–60%) and contamination (bottom axis; 0–60%). Large symbols denote bales analysed in this study and small symbols denote literature values. Bale categories include HDPE bale (blue circles), rigid PP bale (orange squares), film bale (predominantly LDPE, purple triangles) and mixed plastics bale (US #3–7, green crosses; EU mixed, green diamonds). The collection scheme is indicated by symbol fill (PMD, filled; PoSo, open). d, Comparison of mean LAMD of PMD and PoSo target items from sorted bales (PE rigid, PP rigid and mixed plastic) (n = 5 measurements). The grey line indicates equal levels of LAMD and items below or above the line indicate higher LAMD for PMD or PoSo target items, respectively. The inset in the top right corner shows a visual difference between LAMD on a milk bottle (PE2) from post-sorting (above the grey line) and source-separated collection and sorting (below the grey line).Source dataContrary to our initial expectations, our findings align with those of ref. 8, which reported that collection systems exert only a minor influence with respect to bale purity. Although further research is needed, our object-level analysis of sorted bales suggests that the high polyolefin content in PoSo streams may stem from non-packaging plastic items, such as household goods and garden tools, typically manufactured from mono-material HDPE or PP. Alongside simple mono-material objects such as buckets and flower pots, the mixed PoSo bale also contained 15.7 wt% partially plastic items (for example, toys, textiles, and waste electrical and electronic equipment (WEEE)) and 26.1 wt% non-target materials, including paper, metals and residuals (Fig. 1a). Textiles formed the largest non-target fraction (9.4 wt%), and WEEE (1.6 wt%) introduced a heterogeneous mix of plastics, metals, silicone and rubber; along with components such as batteries and microchips that can interfere with sorting (Fig. 1b). These items were found predominantly in the post-sorted mixed plastic bale (n = 21, including 3 WEEE), but also in the post-sorted PP bale (n = 11). Notably, inadvertent inclusion of batteries, particularly lithium-ion types, has been increasingly linked to fires reported at plastic waste sorting and recycling facilities34. Our results indicate that post-sorting of residual waste may introduce these hazardous items into packaging plastic bales, thereby increasing fire risks in facilities lacking appropriate mitigation measures.Residual plastics are dirtier and odorousWe hypothesize that the commingling of plastics with organic waste leads to increased contamination, as measured by LAMD. Our analysis supports this: the highest LAMD observed in source-separated plastic waste (mixed plastics, 12.8 wt%) is lower than the lowest observed in post-sorting (PE rigid, 14.9 wt%) (Fig. 1a). Within PoSo, LAMD increases from PE rigids (14.9 wt%) to PP rigids (17.6 wt%) and LDPE (19.1 wt%), reaching 26 wt% in mixed plastics. In contrast, source-separated LDPE, PE rigids and PP rigids showed lower values (8.0 wt%, 9.9 wt% and 12.1 wt%, respectively). Higher LAMD in PoSo might result from cross-contamination with organic waste and other residues, particularly for flexibles8. The trend is confirmed at the bale and item level (Fig. 1d and Supplementary Information section 3.2). A notable exception are PE rigid items, which showed higher LAMD in PMD than in PoSo, probably owing to residual products in intact bottles. Observations indicate that bottles in source-separated collections are mostly intact, unlike bottles in PoSo bales, which, after collection and compression-induced cracking, cross-contaminate surrounding plastics, and typically contain no residual product. This interpretation requires further confirmation.Although not statistically representative, measured polymer purities and contamination levels fall within literature ranges for multiple regions and collection schemes (Fig. 1c and Supplementary Table 2). Across bale types, source-separated systems consistently achieve higher polymer purities and lower non-plastic contamination. Post-sorted bales show comparable HDPE and PP purity but consistently higher LAMD (Supplementary Information section 3.1.1), indicating a quality penalty despite increased plastic capture. The literature highlights substantial variability across collection systems, MRF configurations and degrees of source separation, indicating that system design, rather than geography alone, is a dominant driver of bale quality (Supplementary Table 2). The findings should therefore be interpreted as representative of modern mixed-waste mechanical sorting systems, rather than of specific national or regional recycling systems.For VOCs, which are linked to potential odour issues of the recyclates, LDPE and PP show higher VOC area count and chemical compound diversity (Fig. 2a). VOC area count represents a semi-quantitative measure of VOC abundance, derived from integrated gas chromatography–mass spectrometry signal areas. The difference is most pronounced for LDPE, with low VOCs in PMD but a threefold increase in PoSo flexibles, probably owing to the high surface area facilitating cross-contamination. PP shows a similar but weaker trend.Fig. 2: Total VOC area and diversity in sorted plastic waste and specific items.The alternative text for this image may have been generated using AI.Full size imagea, Total VOC area and number of VOCs in sorted plastic waste streams. b, Total VOC area and compound count for selected non-packaging plastic items. PE foam was excluded owing to insufficient sample mass for VOC analysis. VOCs are grouped by chemical class, with error bars representing the root mean square of the standard deviation across VOC groups (n = 3 technical replicates). Diamonds indicate the total count of identified VOCs. A list of all identified VOCs is provided in Supplementary Table 3.Source dataPE rigids show higher VOC levels than LDPE, consistent with their use in products prone to aroma compound adsorption35. Notably, PE rigids show higher VOCs in source-separated streams (Fig. 2a), aligning with LAMD results. Detailed results, including mixed plastic PoSo, are presented in Extended Data Fig. 1 and Supplementary Information section 3.3.Chemical class distribution varies markedly. LDPE and PP rigid PoSo show broader chemical ranges than PMD counterparts, suggesting exposure to a wider array of waste materials. LDPE PoSo contains more alkanes (1.2 × 10⁸) than LDPE PMD (1.1 × 10⁷), indicating potential polymer chain degradation, and/or contact with oil-based contaminants or adhesives36. Nitrogen-containing compounds (amines, amides and carbamides) are largely absent in PMD samples, but abundant in PoSo (PP rigid, 6.2 × 10⁷; PE rigid, 6.9 × 10⁷; LDPE, 5.2 × 10⁷), probably linked to protein-rich organics and elevated moisture in residual waste, promoting microbial activity and the formation of nitrogenated VOCs, although the underlying mechanisms require further investigation.For non-packaging plastics in PoSo, VOC levels vary widely (Fig. 2b). Toys show high VOC levels (3.2 × 10⁸, >70 compounds), dominated by alkanes and alkenes, probably owing to prolonged use and ultraviolet-induced degradation37. Textile results vary, with one sample reaching 2.3 × 10⁸ and 70 VOCs, possibly owing to the high surface area and potential adsorption within fibres38; this interpretation remains to be validated.Overall, plastics recovered from residual waste are dirtier and release higher VOC levels than source-separated streams. The effect is strongest for LDPE, where LAMD doubles and VOC emissions triple. HDPE is an exception: intact bottles from PMD streams retain residues, whereas broken bottles in PoSo release and disperse them.Collection and bales affect trace elementsPlastics recovered from residual waste show higher concentrations of trace contaminants than source-separated streams, with dependencies on bale type and collection pathway (Extended Data Table 4 and Supplementary Information section 3.4.3). Washing reduces metal loads (Fig. 3a,b); however, elevated concentrations persist, particularly in mixed plastic and film bales compared with rigids (Supplementary Table 4). Post-sorted bales retain higher metal levels, including restricted elements such as cadmium (Cd) and lead (Pb). The absence of a uniform trend across all fractions reflects the inherent heterogeneity of PPW.Fig. 3: Metal and halogen composition of sorted and washed plastic bales.The alternative text for this image may have been generated using AI.Full size imagea, Percentage change in elemental concentration between washed and unwashed plastic bale samples (PE, PP, LDPE and mixed). Positive values indicate a decrease in concentration after washing. Arsenic (As) and bromine (Br) are excluded owing to non-detection (As) or detection only in one sample (Br). Extreme outliers were removed to improve visual clarity; boxes show interquartile ranges and whiskers 1.5× the interquartile range. b, Table showing TMC in wt% of sorted bales for unwashed (UnW) and washed (W) samples. TMC is calculated as the sum of mean metal concentrations (1 ppm = 0.0001%). c, Scatterplot showing the comparison of metal and halogen concentrations for unwashed sorted bales (LDPE, PE rigid, PP rigid and mixed plastic) from source-separated and post-sorted streams. For the mixed post-sorted plastic bale (mixed PoSo), non-packaging plastic items were removed before analysis and evaluated separately; the bale sample shown here therefore represents packaging plastics only. Values are internally normalized and reported on a scale of 0–1, with 1 indicating maximum concentration. Detected maximum concentration (ppm) is indicated above the scatterplot. d, Images of sampled items (from left to right: chips bag, flower pots, plastic bag, shoes, blister packs), with grey triangles indicating for which trace elements they might be a source of introduction.Source dataPartially restricted metals, including cobalt (Co), copper (Cu), lithium (Li), nickel (Ni) and antimony (Sb), were found in all bales (Fig. 3c and Supplementary Information section 3.4.2). Cd and Pb showed stronger pathway dependence. Cd was enriched in unwashed PE rigid PoSo (6.3 ± 1.1 ppmw, >10× higher than source-separated unwashed PE rigid at 0.4 ± 0.1 ppmw), suggesting PoSo as a potential Cd source, although limited to this fraction. Pb was ubiquitous (1.9–82.3 ppmw), highest in LDPE and mixed plastics (Extended Data Table 4), approaching regulatory thresholds (ΣPb + Cd + Hg + Cr(VI) < 100 ppm; Supplementary Information section 3.4.3). Pb levels exceed reported values in other studies (for example, 7.3 ppmw for HDPE39, below detection for PP rigids and PE films31). Washing reduced Pb by 52% ± 37%, but levels remained up to >1,000% higher in post-sorted samples. These patterns suggest combined inputs from additives, legacy contamination and non-packaging items in residual waste streams.Item analysis confirms non-packaging plastic items as sources. Toys and textiles contribute to specific metal contamination, although their overall total metal content (TMC) is lower than mixed plastic bales. Shoes showed the highest Pb levels (382.9 ± 56.2 ppmw and 913.4 ± 43.1 ppmw), up to 52× higher than mixed unwashed PoSo (Extended Data Tables 4 and 5), exceeding packaging limits (ΣPb + Cd + Hg + Cr(VI) < 100 ppm). Flower pots (PP1) also showed higher concentrations of Pb and Cd (Extended Data Fig. 2 and Supplementary Table 5). Metals probably originate from additives, environmental accumulation (for example, shoe soles may accumulate Pb from historical lead-based paints and environmental dust40,41) or recycled-content inputs (for example, flower pots), indicating that contamination is not solely intrinsic to polymer composition (Supplementary Information section 3.4).Chlorine is a critical parameter for recycling owing to corrosion, catalyst poisoning and thermal degradation. Chlorine was detected in all bales, with higher levels in post-sorted streams (Supplementary Information section 3.4.4). In LDPE, unwashed PoSo reached 2,433 ± 15 ppmw compared with 1,600 ± 0 ppmw in unwashed PMD, with similar trends in mixed plastic bales. Washing reduced chlorine in PoSo LDPE (about 69.9% ± 1.9%, P < 0.05), but only marginally in PMD LDPE (about 6.3% ± 0.0%). Chlorine sources include polyvinylchloride (PVC)-containing materials28,30 (for example, medical blisters, toys, multilayer packaging), halogenated additives and residual detergent contamination30, particularly in HDPE, where chlorine was largely water-soluble (Extended Data Table 4).Non-packaging plastic items showed the highest chlorine burdens, with blister packaging reaching 285,000 ppmw, toys reaching 10,300 ppmw, reflecting PVC composition28, and textiles reaching up to 3,200 ppmw (Extended Data Table 5). Bromine, an indicator for brominated flame retardants, was detected in a CD case, probably introduced during manufacturing42, further highlighting non-packaging contributions to halogen loadings in post-sorted streams.Residual sorting increases feedstockOur model shows that across all clusters (Fig. 4a,b), increasing post-sorting of residual waste (10–75%) consistently enhances plastic packaging recovery (Fig. 4f and Supplementary Information section 3.5). At higher implementation levels, all clusters exceed about 120–140% of baseline recovery (Fig. 4c–e), confirming that substantial quantities of recyclable plastics remain in residual waste streams.Fig. 4: Modelling results for EU27+3 and US submodel.The alternative text for this image may have been generated using AI.Full size imagea,b, Scatterplots showing k-means clustering based on plastic packaging recycling rates (%) and distance to EU plastic packaging recycling target (European Environment Agency reports) for EU27+3 member states (a) and population access to collection (%) for US states (b). Collection access is defined as the availability of recycling collection services, including kerbside, subscription or drop-off systems for single-family households, and on-site facilities for multi-family residences19. c–e, Indexed growth of available recycling feedstock relative to baseline conditions (baseline 100). Growth trajectories are shown for household (HH; c) and commercial and industrial (C&I; d) feedstock across four EU27+3 clusters, and four US clusters (e). Lines represent median values, with shaded areas indicating 90% probability bands (5th–95th percentiles). The dashed horizontal line at 100 indicates the baseline. f, Line plot showing total available PPW feedstock in the EU27+3 (blue) and the USA (red) under different residual to post-sorting scenarios and aggregated across respective clusters. The solid lines indicate the quantity (kt yr−1) available as potential feedstock for recycling operations. The dashed lines indicate the percentage of PPW collected and sorted of the total generated PPW. Total generated PPW is assumed equal to placed-on-market volumes of the same year. Mean values are reported with error bars indicated as s.d. g,h, Sankey diagrams of PPW flow for EU27+3 (g) and US (h) baseline and 75% residual sorting scenarios. Quantities from separate and mixed collection streams are equal in both scenarios, but the share of mixed collected sent to post-sorting differs (cyan rectangle, baseline; ellipse, 75% scenario). Available feedstock and residual waste are indicated by rectangles (baseline) and ellipses (75% scenario). Baseline flows are shown at reduced opacity (40%).Source dataAlthough recovery scales linearly with post-sorting within each cluster, regional trends differ. European Union (EU) clusters show smooth, progressive increases with moderate sensitivity to sorting efficiency, whereas US clusters, especially high-volume clusters (US-1 and US-2), show stronger relative growth and higher sensitivity. These differences are driven by cluster-specific model inputs, such as post-sorting yields and residual waste composition (Supplementary Table 7).The model estimates that the EU27+3 generated 16.1 ± 1.0 Mt (range 13.8–18.5 Mt) of post-consumer PPW, of which 6.9 ± 1.1 Mt (range 4.0–10.4 Mt) is not source-separated (Fig. 4g). For the 75% scenario, up to 2.5 ± 0.7 Mt (range 0.7–5.0 Mt) of the 6.9 Mt PPW can be recovered, increasing recycling feedstock from 7.7 ± 1.1 Mt (range 4.3–10.9 Mt) to 9.3 ± 1.3 Mt (range 5.9–13.8 Mt) (Fig. 4f, blue lines, and Fig. 4g). Most gains are concentrated in EU-4 and EU-2 (approximately 72%), whereas clusters with high baseline collection performance (for example, EU-1) provide limited additional recovery.A similar pattern is observed in the USA, where baseline recovery is low with 1.3 ± 0.1 Mt (range 1.0–1.8 Mt) out of 12.7 ± 0.8 Mt (range 10.8–14.6 Mt) PPW generated across all clusters. Available feedstock could increase to 5.4 ± 1.1 Mt (range 2.5–8.2 Mt) under the 75% scenario (Fig. 4f, red lines, and Fig. 4h). Approximately 75% of additional feedstock originates from large clusters US-2 (1.4 ± 0.3 Mt) and US-3 (1.6 ± 0.4 Mt), indicating that high-volume clusters dominate absolute recovery gains, whereas low-volume clusters (US-4) achieve high relative (Fig. 4e) but limited absolute improvements. These results highlight that post-sorting can act as a high-leverage intervention, particularly in systems with large residual waste streams or limited source-separation.Investment requirements are substantial but vary widely. For the EU27+3, achieving the 75% scenario would require €18 billion (range €7–62 billion), whereas the USA would require US$50 billion (range US$24–115 billion) for post-sorting infrastructure. When normalized to feedstock gains, clusters with larger residual waste streams (for example, EU-4) show more favourable investment efficiency, whereas mature systems require higher investment per unit of additional recovery. Similarly, in the USA, medium-performing, high-volume clusters offer the greatest gains, while both optimized and sparsely populated clusters are less favourable (Supplementary Information section 3.5.4).Importantly, these estimates include only capital expenditure (CAPEX) associated with sorting infrastructure and plastic packaging feedstock. Additional system costs related to waste collection and downstream recycling were not considered. At the same time, post-sorting facilities recover additional valuable fractions (for example, metals, paper and cardboard, glass), while also contributing to avoided disposal costs (Supplementary Information section 3.5). As neither additional system costs nor co-benefits are accounted for in the present analysis, the reported CAPEX should be interpreted as an indicative estimate rather than a comprehensive assessment of overall system costs.Taken together, the results demonstrate that post-sorting can substantially increase plastic recovery and help close the gap to policy targets such as those introduced by the Regulation (EU) 2025/40 on packaging and packaging waste43. However, its effectiveness depends strongly on regional system characteristics and should be considered within broader waste management optimization strategies.Implication for recyclersThe study focuses on a single sorting facility, allowing independent assessment of collection system from sorting technology. Although not statistically representative, the results align with the literature across regions, indicating robust trends despite geographical variability.Our findings show that post-sorting of residual waste can substantially increase recyclable plastics recovery and may complement source separation. However, this additional feedstock is consistently associated with lower material quality. As summarized in Fig. 5 (Extended Data Table 3), PoSo bales achieve comparable polymer purities to PMD but show systematically higher contamination, including elevated LAMD, VOCs, and trace metals and halogens. These effects are polymer specific. PP rigids are comparable across systems, whereas LDPE performs worse in PoSo, and PE rigids show slightly better VOC and chlorine profiles.Fig. 5: Quality and recyclability of unwashed sorted plastic bales.The alternative text for this image may have been generated using AI.Full size imagea–d, Radar charts for PE rigid (a), PP rigid (b), LDPE (c) and mixed plastic (d) bales. Values are internally normalized against the maximum value for each category. The scale goes from 0 to 1, indicating minimum and maximum value, respectively, and with an increase in 0.2 increments. Indicators for which lower values indicate better performance were inverted (1 − x) such that higher values consistently represent better performance. Purity indicates the percentage of the main component (for example, PE in PE rigid) for PE, PP and LDPE (a–c), and PO content in mixed bales (d). VOCs indicates the sum of total area. For mixed PMD, values from the washed samples were used (carbon, chlorine, nitrogen, oxygen and TMC), and VOCs for PMD mixed plastics are based on levels from target items (d).Source dataThese results highlight the quantity–quality trade-off. Post-sorting increases plastic capture, but introduces contaminants from residual waste, including organic residues and non-packaging items, increasing chemical heterogeneity (for example, odour-active compounds, halogens and trace metals) that are only partially removed by washing.From a processing perspective, plastics recovered from residual waste will require more extensive washing to reduce LAMD and VOCs23,44,45, increasing operational complexity and cost46.However, washing does not fully remove embedded contaminants or chemical diversity introduced by non-packaging items. Items such as textiles, medical packaging and toys contribute disproportionally to the presence of restricted metals (for example, Pb) and halogenated compounds, which may accumulate over multiple recycling loops and challenge material quality and regulatory compliance (Supplementary Information section 3.6.1).For chemical recycling, rigid PoSo fractions may be suitable feedstock47,48,49, owing to their high carbon content (>82 m%) (Extended Data Fig. 3 and Supplementary Information section 3.4). However, elevated contamination levels, particularly LAMD, chlorine (up to 2,400 ppmw) and trace metals, reduce effective yield and necessitate additional upgrading steps31,32. Mixed plastic bales are more constrained owing to a lower carbon content (approximately 73.5 m%) and the presence of non-packaging items with distinct elemental compositions, further limiting conversion efficiency (Supplementary Information section 3.6.2).Implication for policy design and targetsOur model reveals that post-sorting may be a high-leverage policy intervention. Incremental increases in post-sorting yield compounding gains when aggregated across clusters, suggesting that current systems operate below their recovery potential. Expanding post-sorting capacity can increase feedstock recovery while reducing regional performance gaps.Beyond post-sorting, recycling rates can be increased through combined policy, infrastructural and behavioural interventions, including extended producer responsibility, recycled-content mandates, and improved collection and sorting systems50,51,52,53. Evidence shows that the greatest losses of plastic packaging occur at the collection stage, exceeding losses during sorting or recycling4,5. Even in mature systems, recycling rates plateau owing to collection and reprocessing losses (Supplementary Fig. 16). This suggests that maximizing early-stage capture, either through improved source separation or, where compliance is low, through post-sorting, remains the most effective lever for recycling rates.Overall, post-sorting can increase plastic circularity, but introduce a consistent penalty in feedstock quality, most pronounced for flexible and mixed plastic streams (Fig. 5). Higher recycling rates do not necessarily translate into higher circularity if feedstock quality declines. Although bale purity is similar across collection routes, post-sorted materials are less suitable for high-grade mechanical recycling, and increasing capture shifts feedstock supply towards lower-quality streams14,54. This may shift reliance towards chemical recycling routes, for example, dissolution, delamination or pyrolysis, which typically have lower mass yields.System optimization should therefore balance early-stage material capture with contamination control, limiting non-packaging inputs, and maintain differentiation between recycling pathways (Supplementary Information section 3.7). Post-sorting should be considered a promising complementary strategy rather than a replacement for separate collection, particularly given concerns regarding heavy-metal contamination and the presence of disruptive items such as batteries.MethodsWaste samplingWaste samples were collected in April (PMD) and June (PoSo) 2023 at a Dutch facility located in the northern Netherlands. The facility serves municipalities in the region and processes household packaging waste collected under two parallel collection systems.Source-separated PMD, comprising plastic packaging, metals and drinking cartons collected separately from residual waste at the household level, is received from municipalities with separate collection implemented, encompassing both urban and rural areas. This PMD waste is subsequently sorted in a mechanical sorting plant. This collection-sorting configuration is implemented in many EU member states under different terminologies (for example, PMD, Leichtverpackung (LVP)), including Austria, Estonia, Germany, Poland, Portugal, Slovakia and Slovenia.In parallel, mixed residual household waste is collected in a single stream from municipalities without separate PMD collection, including densely populated urban areas, and is subsequently post-sorted to recover recyclable materials and organic fractions. This approach is representative of countries and regions that rely on mixed waste collection combined with downstream material recovery.Separately collected PMD waste (PMD) and post-sorted PMD fractions (PoSo) recovered from residual household waste were processed at different times but on the same sorting line that includes a drum screen, magnet, eddy current, wind shifter, near-infrared sorters and manual quality control.Although the precise municipal origin of the individual waste streams cannot be fully resolved, the sampled materials are representative of contemporary European collection and sorting systems that rely on either household-level source separation or mixed waste collection, followed mechanical sorting in an MRF into dedicated recyclable streams (for example, ferrous metals, HDPE rigids, LDPE films).Bale samples were collected randomly in 60-l waste bags in triplicate by bale and collection system directly from the conveyor belts in the manual quality-control cabin, where operators visually inspect the sorted fractions and remove contaminants to ensure product quality, before baling (PE rigids, PP rigids, mixed plastic). LDPE samples were collected at the plant’s own recycling centre (shredded, before pre-wash bunker), and before baling for PMD and PoSo, respectively (Extended Data Table 1). Target items were selected based on ref. 28, which was adjusted to our observations of the material on the conveyor belt in the manual quality-control cabin. For each target sample, for example, a shampoo bottle, a minimum of ten items were collected, that is, ten shampoo bottles of the same brand, sampled both from PMD as well as from PoSo. Target items were later separated into individual components, for example, an HDPE bottle into bottle, closure and label, and mixed to a composite sample per item component (n = 53; Extended Data Table 2). For PoSo, target items also included ‘non-packaging plastic items’ that potentially appear more frequently or exclusively in this collection scheme, for example, toys, textiles and household plastic items, with the aim to assess whether such non-packaging plastic items would cause additional contamination in recycling. Non-packaging plastic items were observed on both the PP rigid and the mixed plastic belts during post-sorting sampling. At the mixed plastic belt, these were not specifically targeted but included within the general grab samples. In contrast, at the PP rigid belt, non-packaging items were deliberately collected to ensure their representation in the analysis, as their occurrence was less frequent. Non-packaging plastic items were grouped into different categories, for example, ‘PP others’, toys, blisters, and combined to composite samples (n = 5, for example, toys, PP others) or analysed as individual samples (n = 9, for example, textiles) (Extended Data Table 2).All samples were placed in plastic bags, labelled and stored at 5 °C until further analysis. Items were processed and stabilized within the next 7–10 days.Waste sample preparationThe sample size of bale samples had to be reduced from 3 × 60 l to approximately 20 l using the quartering method. Target samples were divided into equal fractions. One fraction remained unwashed and the other one fraction was prepared for the measurement of residue content and washing. Non-packaging plastic items were checked for any harmful contents, for example, metal pieces or batteries, and, if present, these were removed. All samples were reduced to flakes by shredding (Shini SH Granulator with sieve size 8 mm). After each cycle, the shredder was cleaned to minimize contamination across samples. Target samples were shredded after washing and drying, as described in the following steps.Quantification of LAMDLAMD was determined by quantifying the weight of each sample before and after washing and subsequent drying28. Washing was performed with an industrial-style washing machine at 60 °C with tap water. Depending on the grade of contamination, washing cycles ranged from one to three cycles. Items that are hard to clean owing to their design, for example, bottles, were cut open before washing. For heavily contaminated items, a hand wash with cold water and a scrub was used to remove visible dirt and food residue before the washing cycle. After washing, all samples were dried at atmospheric pressure at 60 °C until constant weight was achieved (typically around 1 day), and weighing was repeated for dried samples. For target items, separable packaging subcomponents such as closures and labels were removed, and weighing was repeated for each washed and dried items’ main and subcomponents. For each target item, mean values are reported (n = 5). Calculations to obtain the average residue content per waste stream are detailed in Extended Data Table 3 and Supplementary Information section 1.2.Quantification of polymer compositionThe polymer composition was determined using attenuated total reflection-Fourier transform infrared (ATR-FTIR) spectroscopy (Nicolet iS20 FTIR Spectrometer). ATR-FTIR settings were programmed to 32 scans with a resolution of 4 cm−1 per analysis. Wavenumber region ranked from 400 cm−1 to 4,000 cm−1.From washed and shredded bale samples (flakes), 100 flakes were randomly selected. The sample was first homogenized by hand to minimize segregation, then divided into four piles following the quartering method, from which flakes were randomly picked for analysis. Each flake was analysed on both sides, sorted into component-specific containers and weighed. The overall composition was calculated from the average weight of the identified polymers and polymer combinations relative to the total flake weight. Later, the composition was corrected based on the measured LAMD of the sorted bale. Samples were analysed in triplicate (3 × 100 flakes), and the average is reported. On the basis of these values, bale quality, that is, percentage of target polymer in sorted bale, was calculated (Extended Data Table 3). Values are reported as sum of mono and multi-materials, for example, PE mono and PE multi-material.For the mixed PoSo bale, quantification of polymer composition included an initial visual inspection after sample collection and before further sample preparation. The visual inspection included manual sorting of mixed PoSo sample into polymer fractions based on plastic resin identification codes (PET, HDPE, PVC, LDPE, PP, polystyrene, others), if the codes were visible. For films, this was largely not possible, and films were sorted into LDPE (shopping bags, waste bags) and mixed polyolefins (mixed flexible foils, for example, vegetable wrapping, cheese packaging, shrink wrap). For heavily degraded plastics, a fraction named ‘other plastics’ was added. Films, MPO and other plastics could later be identified based on above described ATR-FTIR method. In addition, non-polymer packaging and other material fractions were included, namely, textiles, paper, WEEE, metals, rubber, toys and residue. Residue included organics and sanitary products. Each manual sorted fraction was weighted on a digital scale with accuracy of ±0.01 kg. After manual inspection and weighing, non-packaging plastic items and other materials were separated from the polymer fractions. Polymer fractions were combined and sample preparation followed the described methods for sorted bales. Non-packaging plastic items were kept separate and analysed as described. For quantification of the polymer composition of the mixed PoSo bale, the results from ATR-FTIR and visual inspection were later combined. The weight ratio of polymer to non-polymer fractions was determined during visual inspection. The ratio was used to rescale the ATR-FTIR polymer results to account for non-packaging plastic items in the overall sorted bale composition. No dedicated hand-sorting was performed on PMD-derived mixed plastic samples; however, no identifiable non-packaging plastic items (for example, textiles, WEEE, toys) were observed during visual inspection of the conveyor belt and the bale sample, although minor contamination (for example, organics or small non-target fragments) cannot be excluded.Polymer composition of target items including individual item components was analysed (Supplementary Information section 1.3) but excluded from bale composition.Quantification of elemental compositionFor the elemental composition, sample preparation required further size reduction from flakes to powder. Of each shredded sample, approximately 10 g of flakes were randomly selected by the quartering method. The selected flakes were further homogenized by a Fritsch Pulverisette 19 using a sieve cassette with 4 mm square perforation. Cryogenic grinding was applied for further size reduction and homogenization of the samples using a ball mill from Anton Parr (BM500) with liquid nitrogen for cooling. Lastly, the powder was sieved through a 425-μm sieve. The elemental composition of unwashed and washed bale samples, and target items was quantified. If target items consisted of different components, then each component was prepared and analysed separately, and the elemental composition of the main component, for example, PE bottle, and total target item, for example, PE bottle, PP closure, paper label, is reported. The calculation method of total target items is detailed in Supplementary Information section 1.4.Data normality was assessed with the Shapiro–Wilk test. On the basis of the results, either a two-sided Student’s t-test or Wilcoxon signed-rank test was performed, with P < 0.05 considered significant.CHN/O analysisCHN/O analyses were performed using a Flash EA2000 elemental analyser (Interscience) equipped with a thermal conductivity detector using a method described by ref. 55. Samples were analysed at least in triplicate. Nitrogen and oxygen levels are included in the set of quality indicators outlined in Extended Data Table 3.Metal concentrationMetals (aluminium (Al), arsenic (As), calcium (Ca), cadmium (Cd), cobalt (Co), copper (Cu), iron (Fe), kalium (K), lithium (Li), natrium (Na), nickel (Ni), lead (Pb), antimony (Sb), selenium (Se), titanium (Ti), vanadium (V)) were analysed using induced coupled plasma optical emission spectroscopy based on the method described in ref. 39. We used 0.2 ± 0.01 g of sample (powder) for digestion, and complemented the CERTIPUR multi-element standard solution IV (100 mg l−1 in 10% HNO3) with single-element standard solutions for As, Sb, Se, Ti and V (100 mg l−1 in 10% HNO3). A comprehensive list of analysed metals, limit of detection, limit of quantification, viewing mode and emissions lines can be found in Supplementary Table 1. Each sample was analysed in triplicate. TMC was adapted from ref. 14, and is calculated based on the sum of concentrations of measured metals (Extended Data Table 3).Halogen concentrationHalogen content (chlorine, bromide, fluoride) was determined by combustion ion chromatography using a Metrohm IC Eco equipped with a 863 Compact IC Autosampler and an ICS-3000 conductivity detector operated at 250-μl sample loop volume, using 10.0 mM carbonate/5 mM bicarbonate eluent at 1.0 ml min−1. Before analysis, samples (powder) were pelletized into pellets of 0.02 ± 0.01 g, placed on the carrier glass including an ashless filter paper with 50 μl of 50 m% ammonium nitrate to initiate combustion, and placed into combustion vessels including 8 ml of aqueous solution of 1 mM NaHCO3 and 8 mM Na2CO3 to collect the vapours. Before the oxygen combustion, combustion vessels were put under pressure (20 bar) that builds to a maximum of 65 bar and 225 °C within 10 min during the combustion process of the Anton Paar Multiwave 5000. The resulting solution was diluted with double-distilled water to 25 ml, filtered using a syringe filter (CHROMAFIL, regenerated cellulose membrane of 0.45-μm pore size), and stored at 4 °C until combustion ion chromatography analysis. All samples were analysed in triplicate. Chlorine content is included in the set of quality indicators outlined in Extended Data Table 3.VOC analysis of unwashed samplesFor VOC analysis, sample preparation included sample selection and drying of wet samples for 48 h with a desiccator using CaCO3 as a drying medium. For analysis, 1.0 ± 0.01 g of unwashed and shredded sample was transferred into a glass vial, sealed and stored in a fridge (5 °C) until analysis. All samples were analysed in triplicate. Aqueous washing was not evaluated as a separate VOC removal step, as previous studies56,57,58,59,60,61 and industrial observations (Supplementary Fig. 2) show that washing alone does not consistently reduce VOC levels in polyolefin packaging and may not explain collection-scheme-dependent differences (Supplementary Information section 3.3.3). The VOC analysis was performed using headspace-solid-phase microextraction-gas chromatography–mass spectrometry with a method described in ref. 62. Only compounds tentatively identified as VOCs, with a sufficiently high match rating from the National Institute of Standards and Technology mass spectral library, are reported.We report VOC diversity, that is, total count of identified VOCs, and VOC area count. The VOC area count represents a semi-quantitative measure of the relative abundance of VOCs, derived from the integrated gas chromatography–mass spectrometry signal area across detected VOC peaks (Extended Data Table 3).Quality indicatorsIn this study, feedstock quality refers to the measurable characteristics of sorted plastic waste streams that influence their suitability for downstream recycling operations. Feedstock quality is described using eight indicators: purity, carbon content, chlorine, nitrogen, oxygen, TMC, LAMD and VOCs (Extended Data Table 3). Throughout the paper, we distinguish between feedstock quality, which is analytically measured, and recyclate quality, which refers to the anticipated performance of recycled materials based on these feedstock characteristics.For purity and carbon content, high values are preferred. These indicators are also used to compare and discuss the suitability of sorted bales for the downstream recycling process. For mechanical recycling, a standard mechanical recycling operation is considered, for example, size reduction, purification, washing and extrusion. Feedstocks with high purity, low LAMD and low VOCs are preferred11,23. For chemical recycling, the discussion is limited to pyrolysis as pyrolysis is a relatively mature technique and, in light of the recently introduced EU regulation 2025/40 targets43, is regarded by the industry as the most likely recycling method to deliver food-grade application recyclates23. Pyrolysis feedstocks have strict requirements on purity, carbon, nitrogen, oxygen and chlorine content47,48, while LAMD can be of importance owing to additional and unpredictable contaminants, and VOCs are of less importance. Given the extensive chemical diversity of plastics waste63, the indicators were selected to serve as pragmatic yet robust proxies, enabling assessment of feedstock quality in recycling practice.Recycling feedstock modellingWe developed a cluster-based material flow analysis4,5,54,64,65,66,67 to quantify the availability of recycling feedstock for the EU27+3 and the USA under increasing levels of post-sorting residual waste. The baseline year was 2022 for the EU27+3 and 2018–2022 for the USA, reflecting the data availability of key parameters. Owing to the short lifespan of plastic packaging, annual placed-on-the-market volumes were assumed to equal waste generation in the same year. Countries and states were grouped into four clusters per region using k-means clustering based on reported plastic packaging recycling rates (ref. 19 and EUROSTAT68), access to collection systems (USA, ref. 19), and proximity to policy targets (EU, European Environment Agency reports), representing system performance archetypes rather than individual jurisdictions (Fig. 4a,b, Supplementary Information section 1.5 and Supplementary Table 6). For each cluster, plastic packaging flows were modelled from generation through separate collection, residual waste and sorting, with cluster-specific collection rates and sorting yields (Supplementary Table 7). EU27+3 clusters were further differentiated into household, and commercial and industrial streams.Scenario analysis examined the effect of increasing the routing of residual waste shares (10–75%) to post-sorting facilities, without assuming technological improvements in sorting performance. The primary outcome was the quantity of sorted plastic packaging exiting MRFs, used as a proxy for the availability of recycling feedstock. Recycling rates were calculated only ex post for model validation (Supplementary Information section 1.5.6). Parameter uncertainty was addressed by Monte Carlo simulation (10,000 runs) using triangular input distributions. The model was designed to assess relative scenario-driven changes rather than predict exact national recycling rates.A separate order-of-magnitude CAPEX assessment was conducted to estimate additional sorting infrastructure requirements (Supplementary Information section 1.5.7). Results for the 75% scenario are reported using two complementary indicators: (1) total CAPEX of required post-sorting infrastructure (MRFs) and (2) CAPEX per percentage point increase in recycling feedstock availability. A global sensitivity analysis for (1) and the calculation framework for (2) are provided in Supplementary Information sections 1.5.7–1.5.9 and 3.5.5, and Supplementary Table 10.For the USA, CAPEX figures were converted using an exchange rate of US$1.13 per €1 based on historical average exchange rates. The cost assessment is intentionally limited to CAPEX for post-sorting infrastructure. It does not aim to evaluate economic feasibility, profitability or market dynamics, which would require additional assumptions beyond the scope of this study.All simulations were implemented in Analytica 6.4 (Lumina Decision Systems). Key parameters and assumptions are summarized in Supplementary Tables 7–9. Median model values for the baseline and calculation steps are provided in Extended Data Table 6. Detailed method descriptions can be found in Supplementary Information section 1.5; model limitations are discussed in Supplementary Information section 3.5.6.
Analysis of trade-offs of post-sorting plastic packaging - Nature
An analysis of post-sorting plastic packaging shows that target polymer purity is similar across source-separation and post-sorting pathways, but post-sorted plastics contain more contaminants that need to be removed before recyclate production.
10,106 words~46 min read