TL;DR
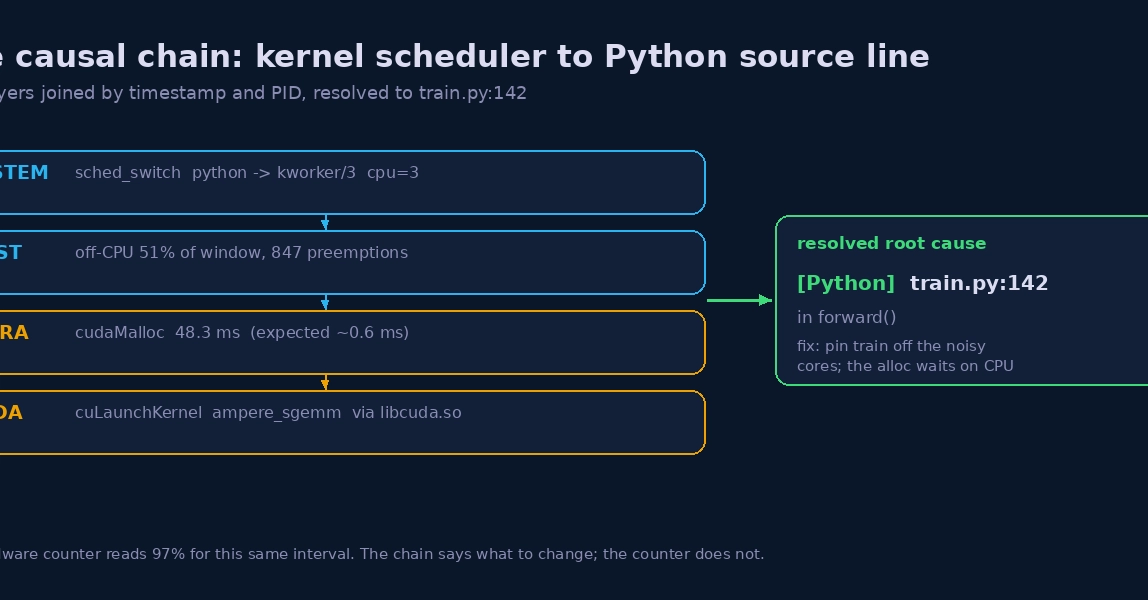
A GPU that reports 97% utilization can still be the slowest part of a training step, and the reason usually lives outside the GPU: a CPU scheduler preemption, a driver-level allocation, a collective waiting on a straggler rank. Reading that reason off the hardware counters is impossible because counters do not carry causality. An eBPF agent that attaches to the CUDA runtime, the CUDA driver, and the kernel scheduler at the same time can correlate those layers by timestamp and PID, then resolve the stall to the exact line of the training loop that triggered it. This post walks the chain from a sched_switch to train.py:142.
The way this gets debugged today
A training step slows down. The first tool anyone reaches for is nvidia-smi, which reports utilization in the high 90s and memory comfortably under the limit. Nothing actionable. The next step is a profiler. Nsight Systems and Nsight Compute produce excellent traces, but their overhead is large enough that they are development tools, not something left running on a production training job. So the investigation falls back to the oldest method there is: add timing prints around suspect sections, rerun, read the numbers, move the prints, rerun again. On a multi-hour job on rented hardware, each iteration is expensive, and the prints only ever measure what someone already suspected.