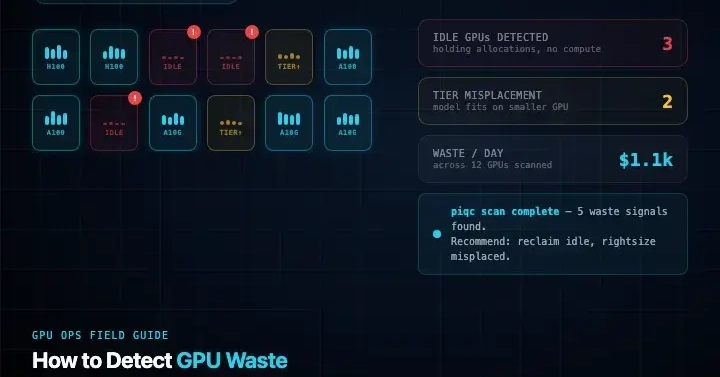
GPU waste in Kubernetes does not announce itself. Your cluster shows healthy utilization. Your dashboards are green. But 20–40% of your GPU capacity is doing nothing useful — burning money quietly in the background.
This post covers what GPU waste actually looks like in Kubernetes, which signals surface it, and how to go from suspicion to a concrete dollar figure.
Why Standard Kubernetes Monitoring Misses GPU Waste
Kubernetes was designed for CPU and memory workloads. Its built-in metrics — kubectl top, kube-state-metrics, node allocations — see resources at the pod level. They tell you a GPU is allocated. They do not tell you whether anything useful is running on it.
The most common forms of GPU waste in Kubernetes are invisible to standard tooling: