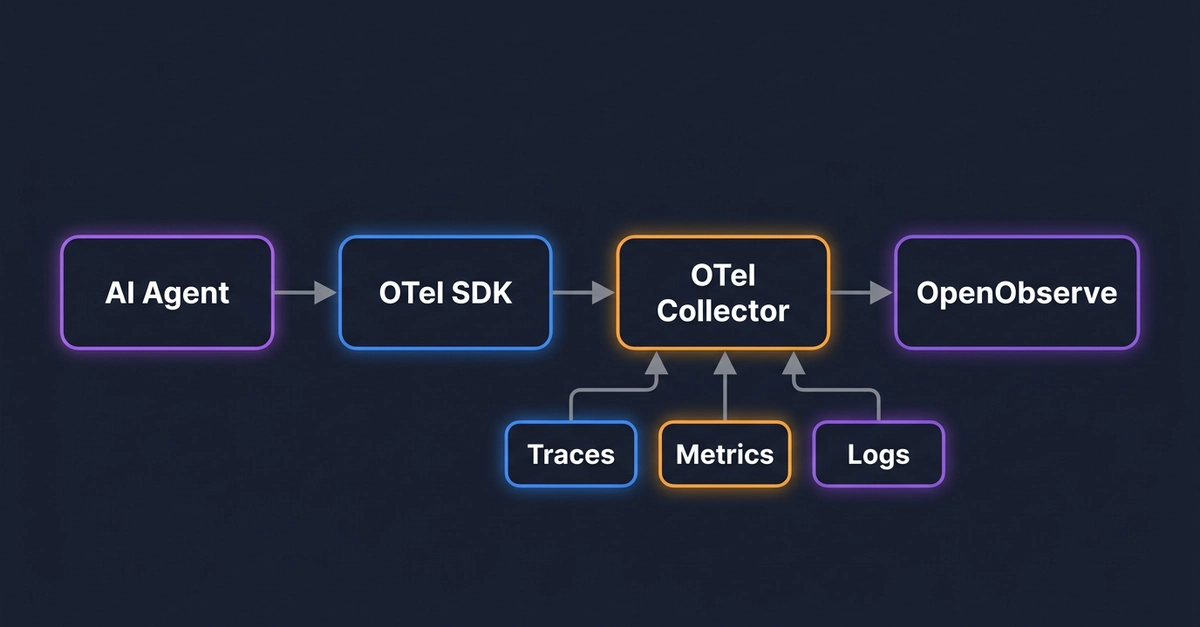
AI agents tend to function as black boxes, and it can be difficult to trace and understand agent workflows end-to-end in order to characterize performance. Particularly, you need visibility into the following:
Agent steps leading to LLM calls, including input prompts and responsesWhich tools the agent invoked and how they executedContext injections and data transformations across the full workflowRequest latency and token consumption to understand performance and cost
By tracing full agent runs with LLM Observability, Datadog AI Agent Monitoring enables you to visualize workflows with flame graphs and quickly spot sources of failures and latency. LLM Observability also performs automated LLM-as-a-judge evaluations to help you characterize response quality and improves agent observability across your organization by connecting this telemetry data to dashboards, alerts, APM, and more.
In this post, we’ll explore how you can use AI Agent Monitoring to instrument an agent application built with LangGraph and monitor this application’s performance and reliability. We’ve adapted this agent from a sample LangGraph agent found in Build & Run AI Agents, an agent handbook originally published in Japanese by the open source engineer Minorun. First, let’s take a look at this sample application.