A single slow query can cascade through your entire application. It holds connections, stalls other transactions, and drives up your cloud bill. When that moment arrives, EXPLAIN ANALYZE is the single most important diagnostic tool you have.
What Is EXPLAIN ANALYZE?
PostgreSQL ships with two related commands:
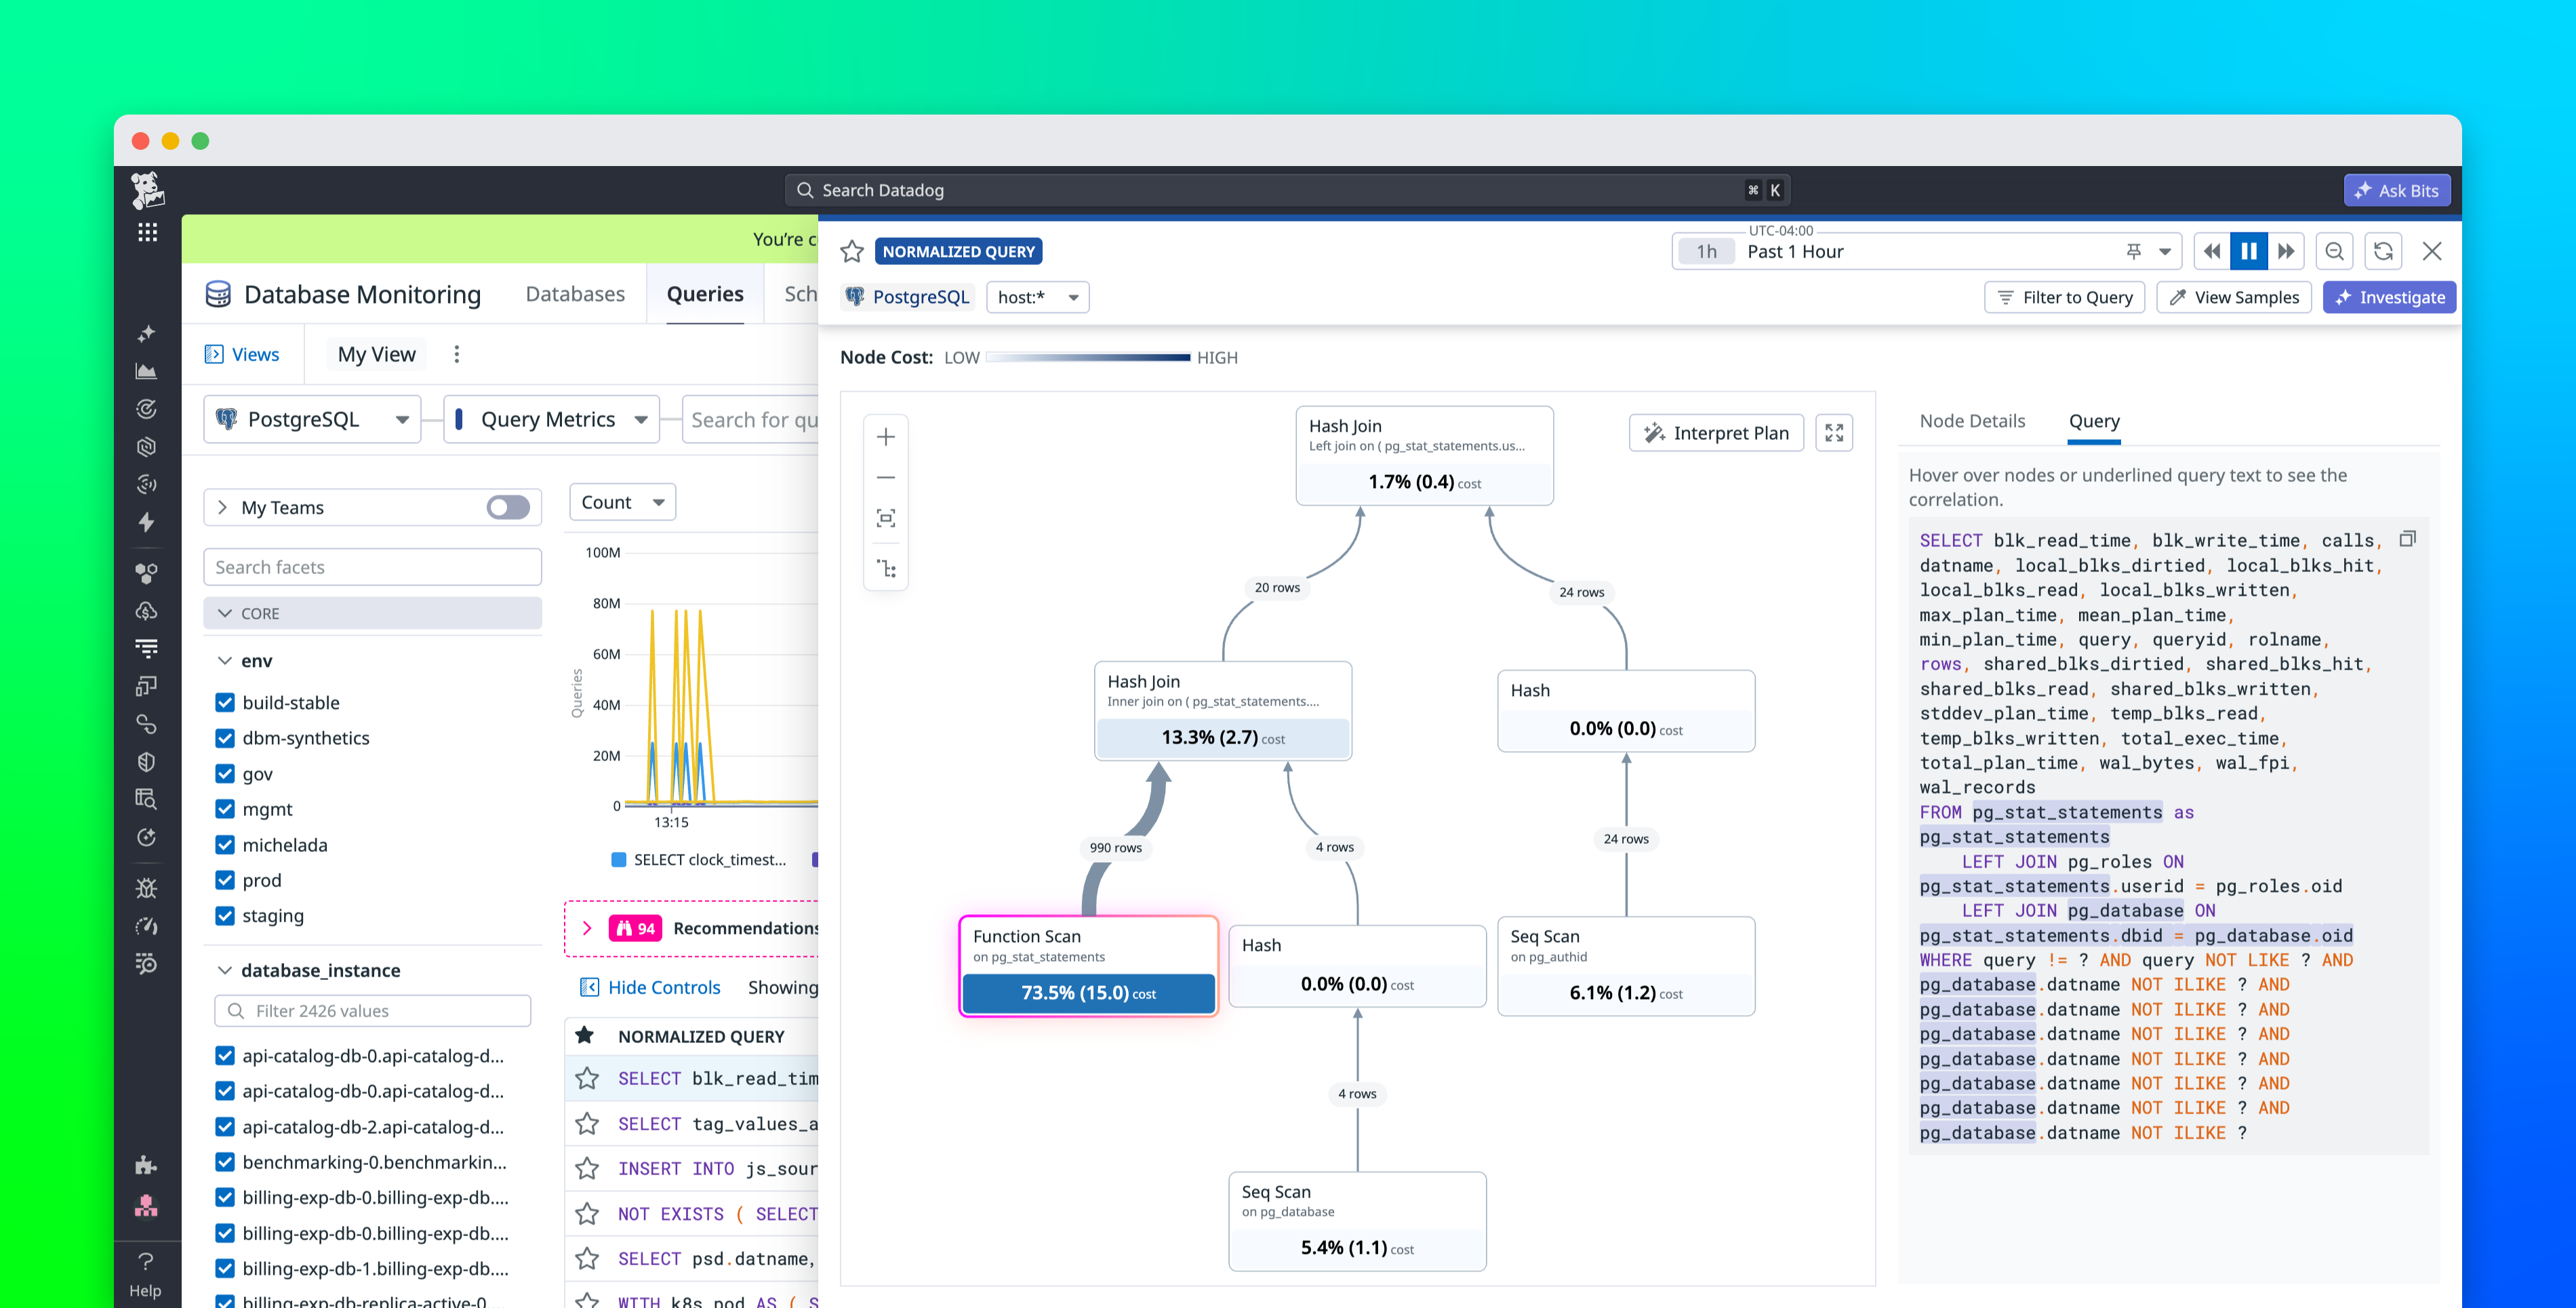
EXPLAIN displays the query plan the planner intends to use. It shows estimated cost, expected row counts, and chosen access methods without running the query.
EXPLAIN ANALYZE does everything EXPLAIN does, then executes the query for real. The output includes actual runtimes, actual row counts, and loop counts for every node.