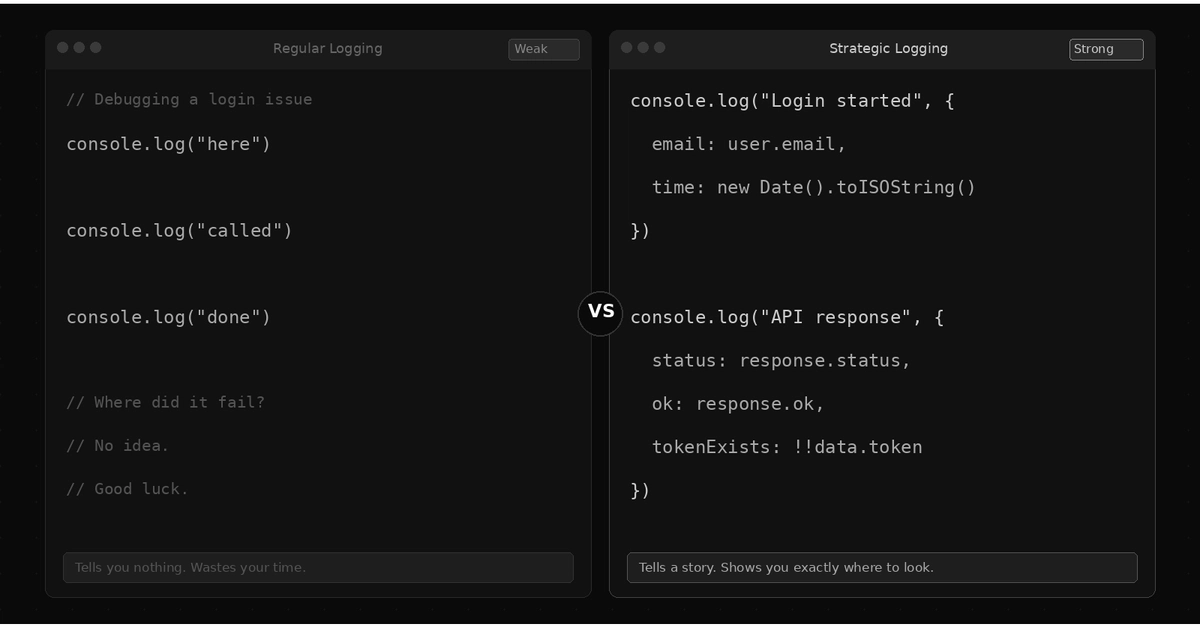
Roughly 80% of Flask applications still rely on basic print() statements or unstructured logging.info() calls for observability in production. Despite widespread adoption of modern monitoring tools like Datadog, Loki, and Elasticsearch, most Python web apps ship logs as plain text — making debugging slow, filtering unreliable, and alerting brittle. This isn’t a legacy issue; it’s happening in brand-new Flask services today.
Can I use both Python logging and Loguru in the same app?
How do I rotate JSON log files in production?
Are JSON logs slower than plain text?
The Python logging module is not a thin wrapper around print() — it’s a fully composable system for routing, formatting, and filtering log records based on severity, source, and custom context. Every log call (e.g., logger.info("User logged in")) creates a LogRecord object. This record contains metadata — timestamp, filename, line number, function name, log level — before any formatter processes it. That metadata enables deterministic serialization into JSON without context loss. To emit structured output, replace the default logging.Formatter with one that serializes the record.