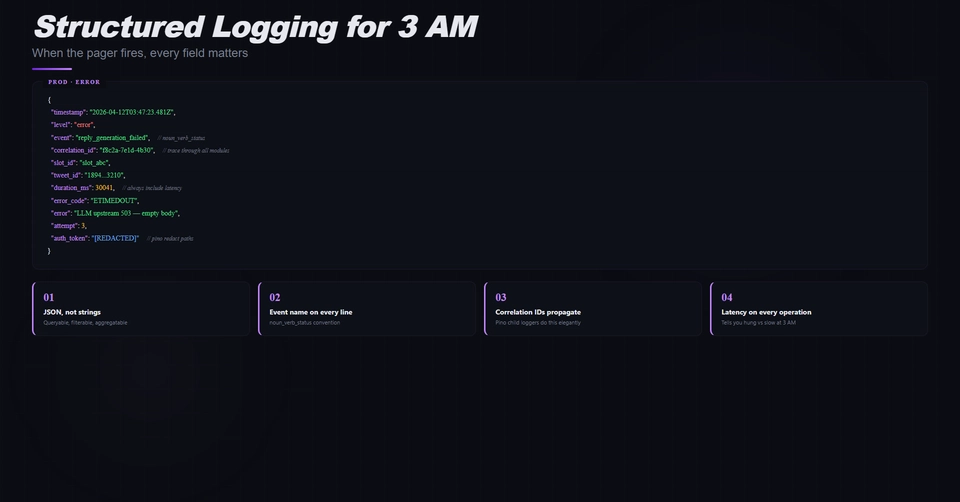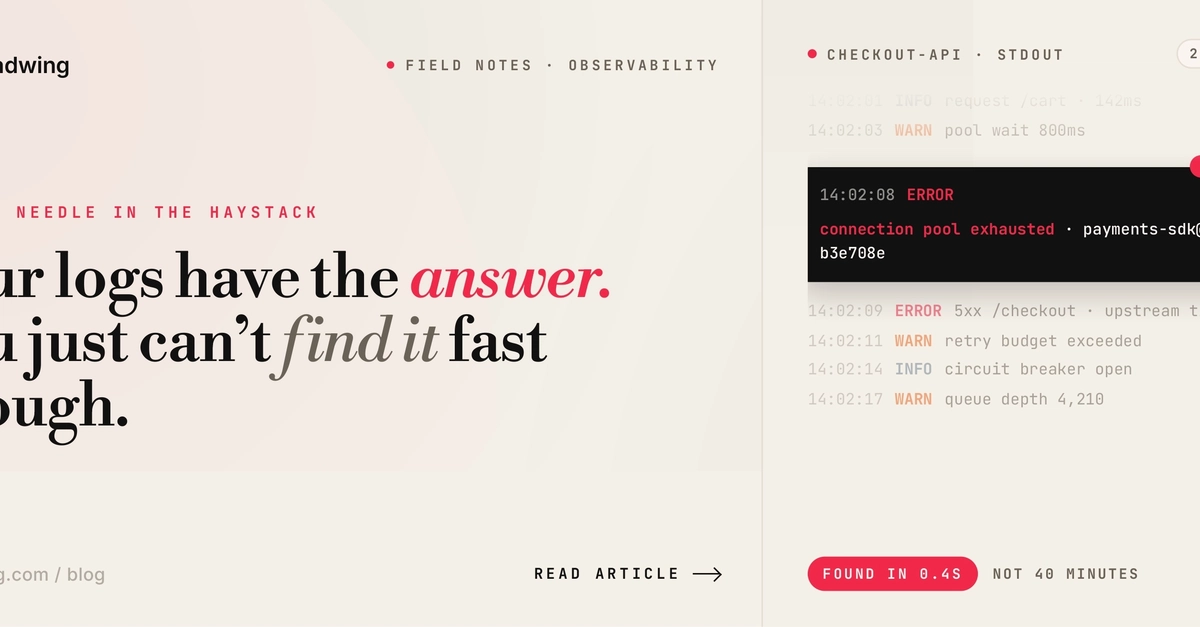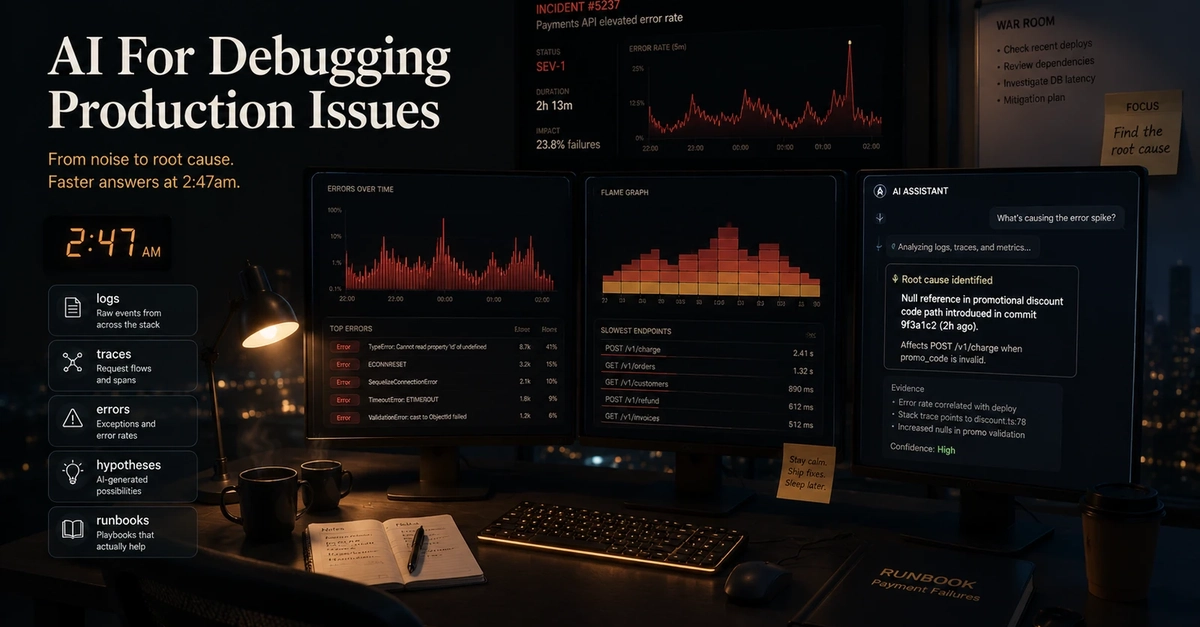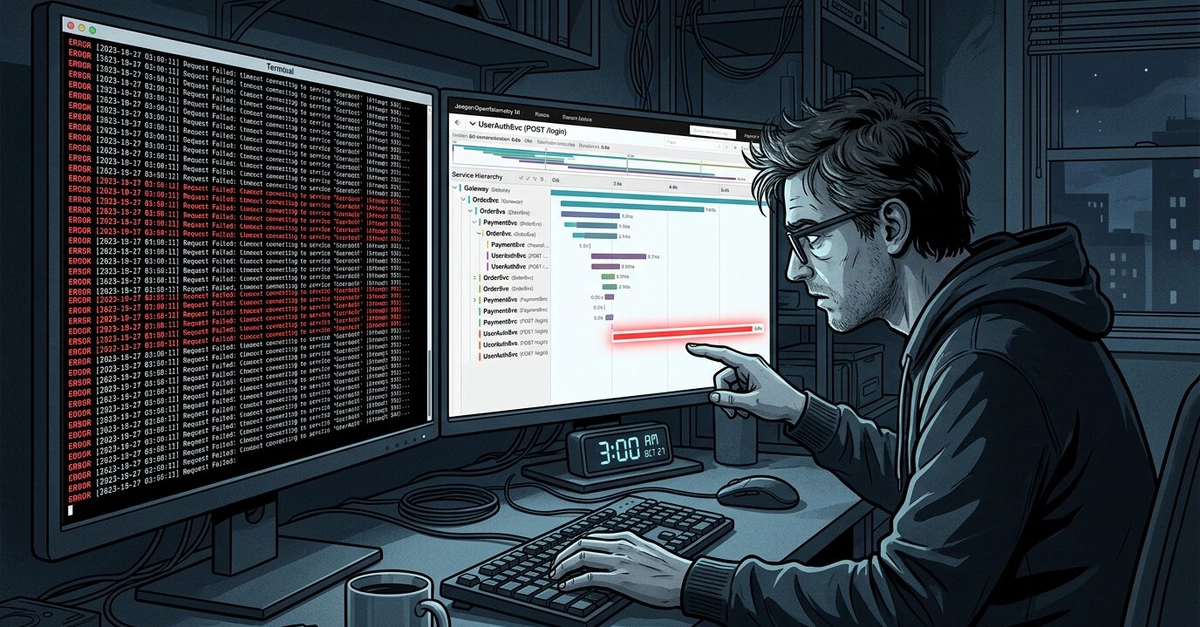
It is three in the morning, the on-call rotation is awake, and the logs scroll past at a rate the eye cannot track. Ten thousand identical lines reading "ERROR Request failed: Connection timeout" appear in the last fifteen minutes. The timestamps are dense, the request paths blurred, the causal chain absent. Somewhere in the system, a downstream call to an inventory service is failing. The log file does not, in any column, tell anyone which downstream call, which upstream caller, which user request started the cascade, or which retry attempt happens to be the one currently scrolling.
I want to take that scenario seriously, because it is not a logging-quality problem. The logs in question are well-formatted, well-timestamped, and well-aggregated. The team is doing all the things the 2014-vintage advice columns recommended. The problem is structural: a log line is the wrong unit of analysis for the failure they are looking at, and no quantity of better log lines will turn the wrong unit of analysis into the right one. The unit they need is the trace.
What a log line actually is
A structured log entry answers a specific question: "what did this service observe at this moment." It is local to the service, local to the moment, and — by design — has no native concept of where in a wider request lifecycle it sits. In a monolith this is a survivable limitation; the entire request runs in one process, every log line shares an in-memory request context, and a request_id field is enough to grep the picture together after the fact.