ClickHouse is widely used for large-scale analytics, but once it is running in production, it can be difficult to understand how query activity translates into resource usage. Engineers investigating performance issues often struggle to determine which queries consume the most memory, run most frequently, or cause spikes in load. In practice, engineers are left querying system.query_log, tailing server logs, and piecing together information after an incident. While this can show what queries are running at a given moment, it does not provide a consistent way to compare queries across a cluster. It also does not reveal the overall impact of a query or show what it actually costs once it is finished.
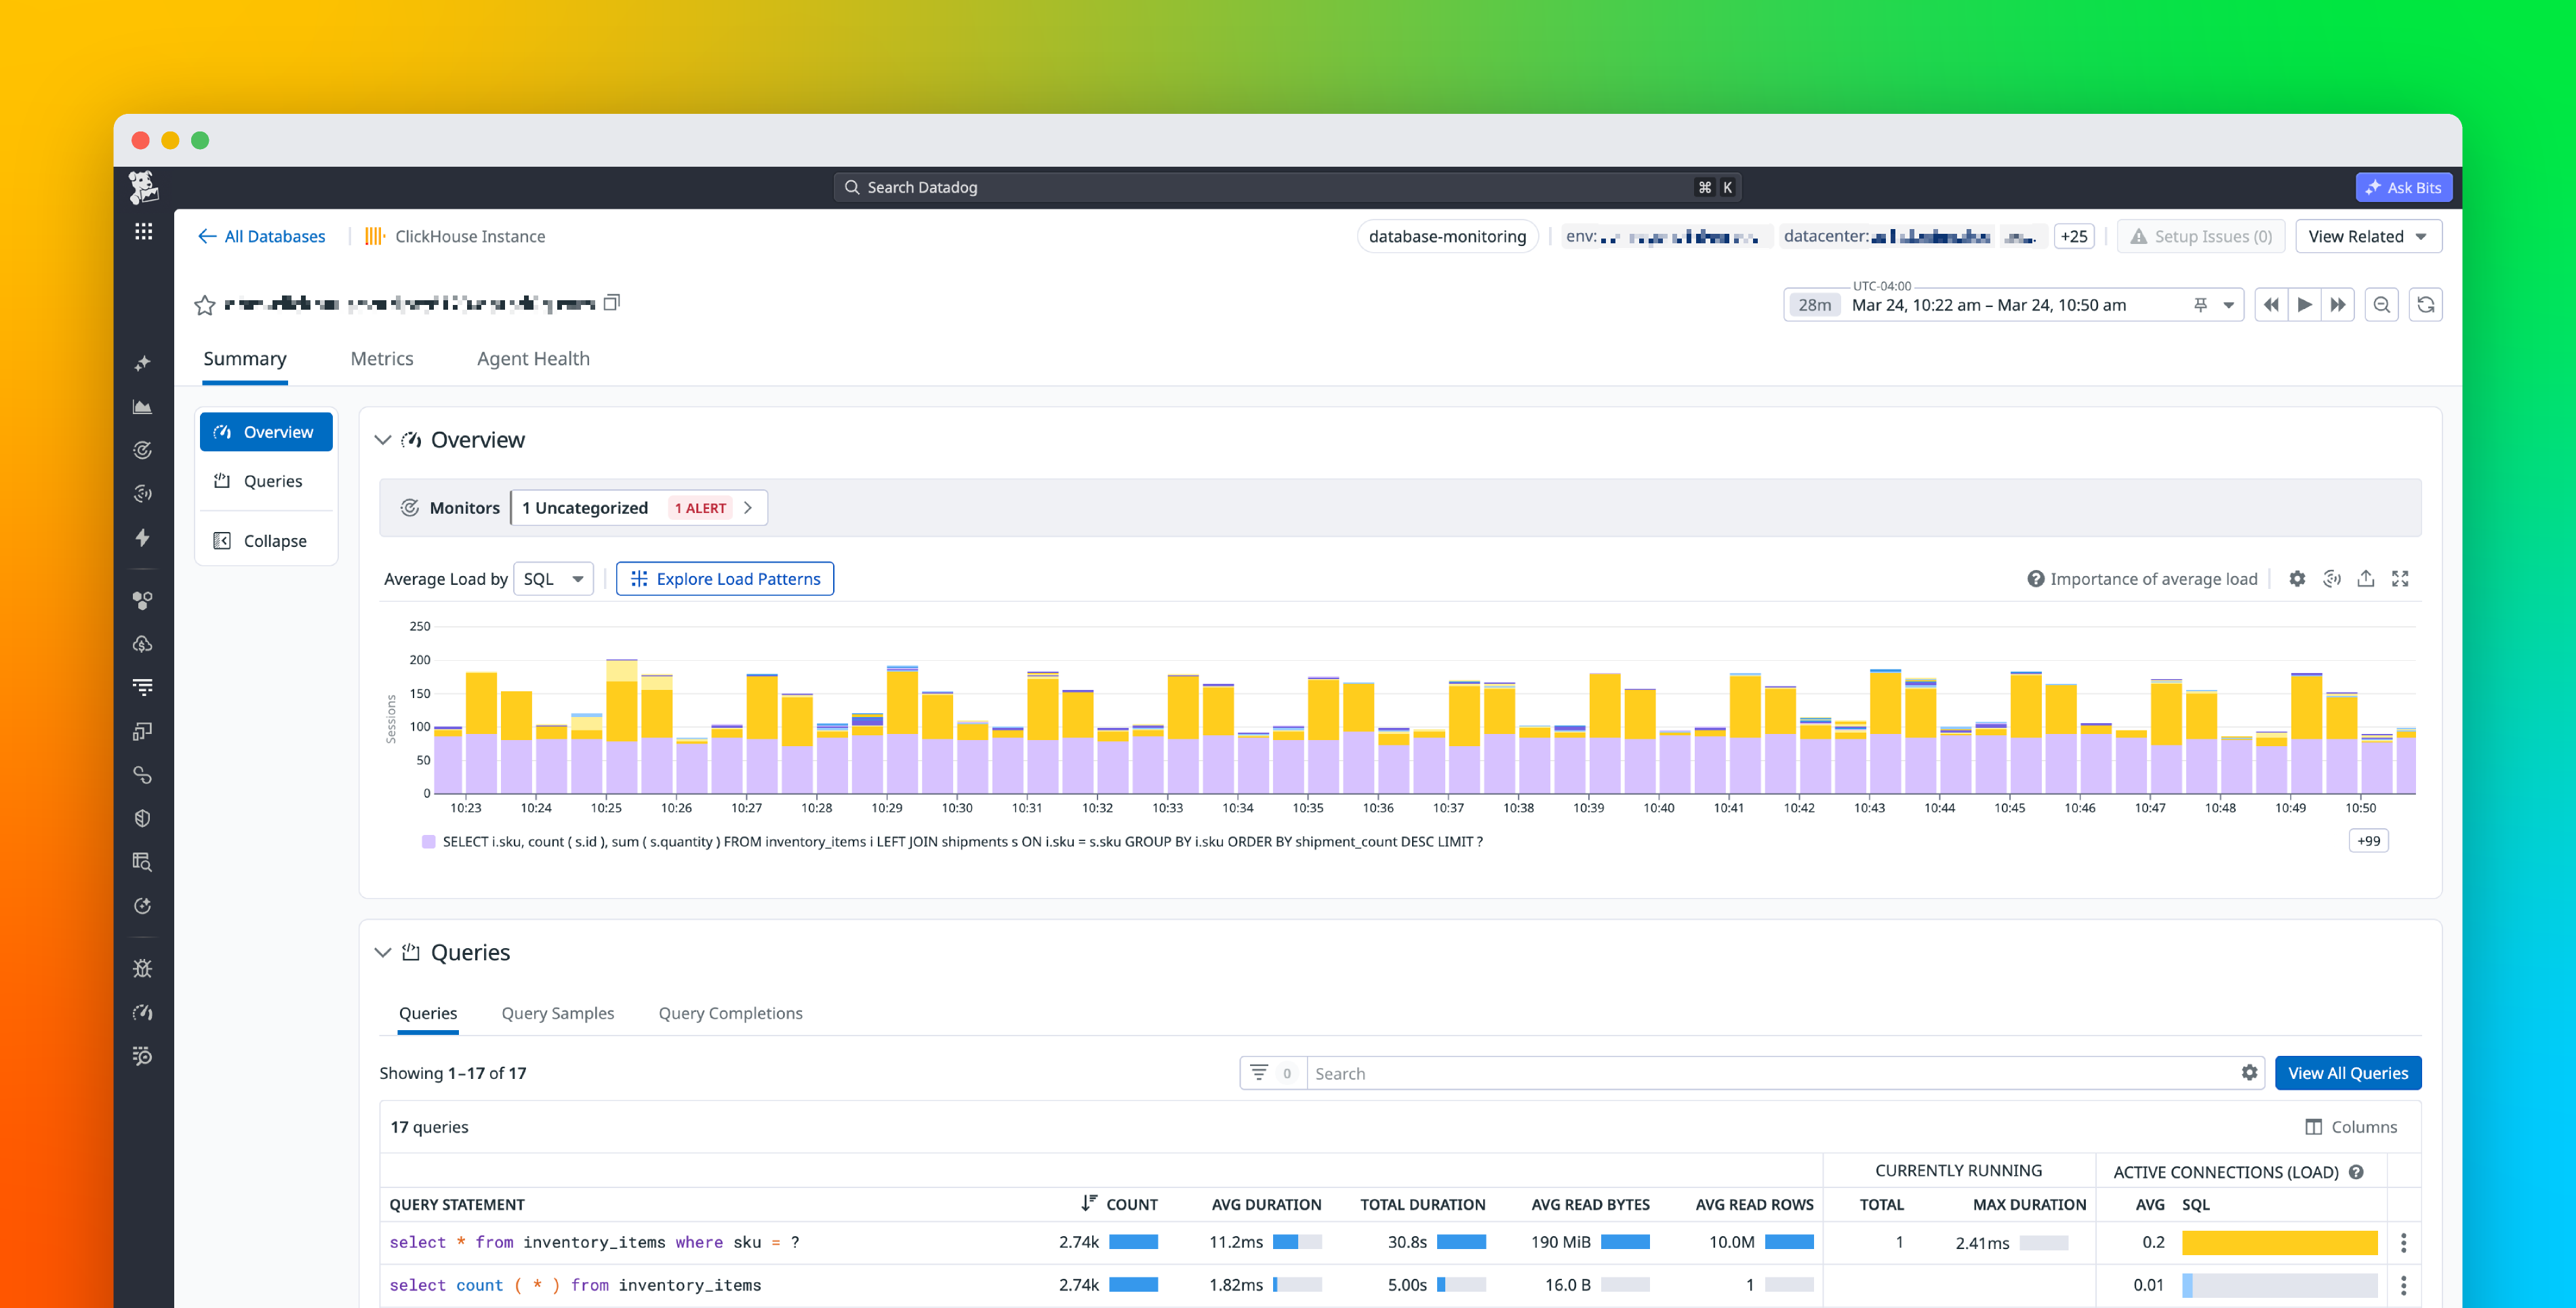
Datadog Database Monitoring for ClickHouse, available in Preview, provides a unified view of query performance across both ClickHouse Cloud and self-hosted deployments. It collects aggregated query metrics, captures completed query samples, and surfaces real-time query activity so that teams can identify inefficient queries, investigate incidents, and optimize workloads.
In this post, we’ll cover how Database Monitoring for ClickHouse helps you:
Find your most expensive queriesReconstruct what happened during an incident