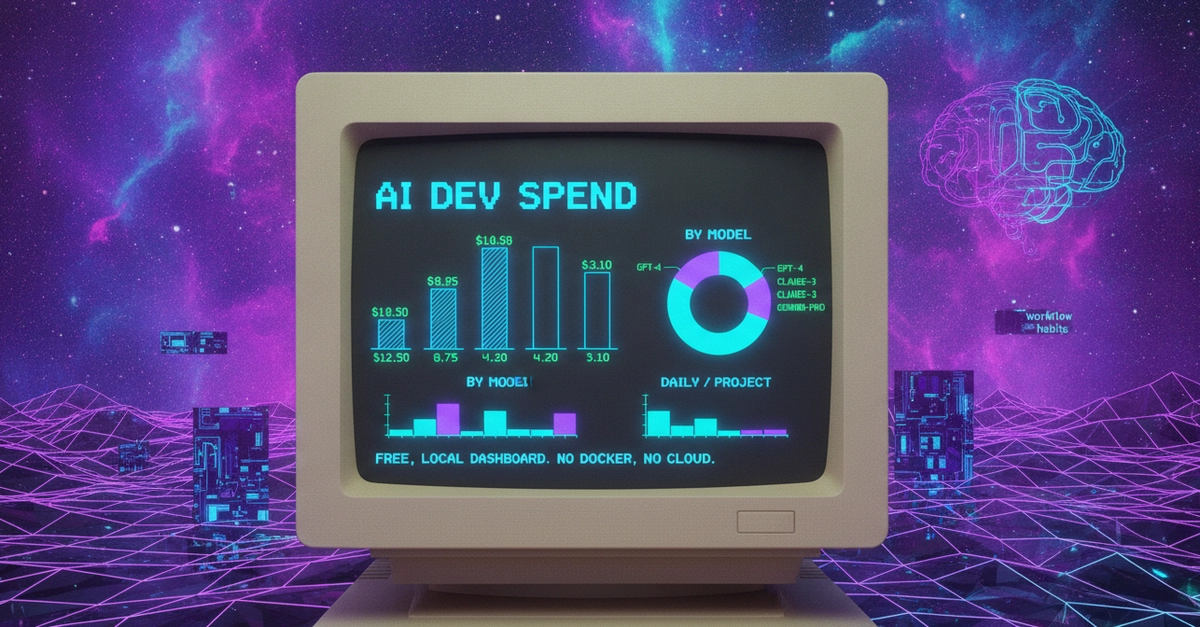
I let three different AIs work in my homelab every day — a coding assistant, a second CLI for pair-work, and a small agent that triages alerts overnight. One evening I realized I couldn't answer a basic question: what is all of this actually costing me? Two burn subscription quota I've already paid for, one spends real API dollars, and none showed up on the Grafana dashboards I'd built for everything else in the rack.
So I fixed it. Every call from every AI in the lab — tokens, latency, cache hits, and dollars — now lands in Prometheus and one Grafana dashboard. This walks through the four measurement legs, the PromQL traps that made my first dashboard lie, and the privacy scrub that makes the screenshots publishable.
Make the addresses your own. Every machine-specific value here is a placeholder: the monitoring host 10.0.0.5, agent host 10.0.0.7, Ollama nodes 10.0.0.1–10.0.0.3, exporter ports, and any /home/youradmin paths.
Why measure AI at all?
The AI layer has a genuinely weird cost structure. Two interactive CLIs run on flat subscriptions, so their "cost" is quota — a percentage of a weekly allowance. The automated agent calls a hosted API and pays per token. Same lab, three billing models. So the dashboard has two columns: quota burn (a percentage that resets) and real dollars (the metered agent).