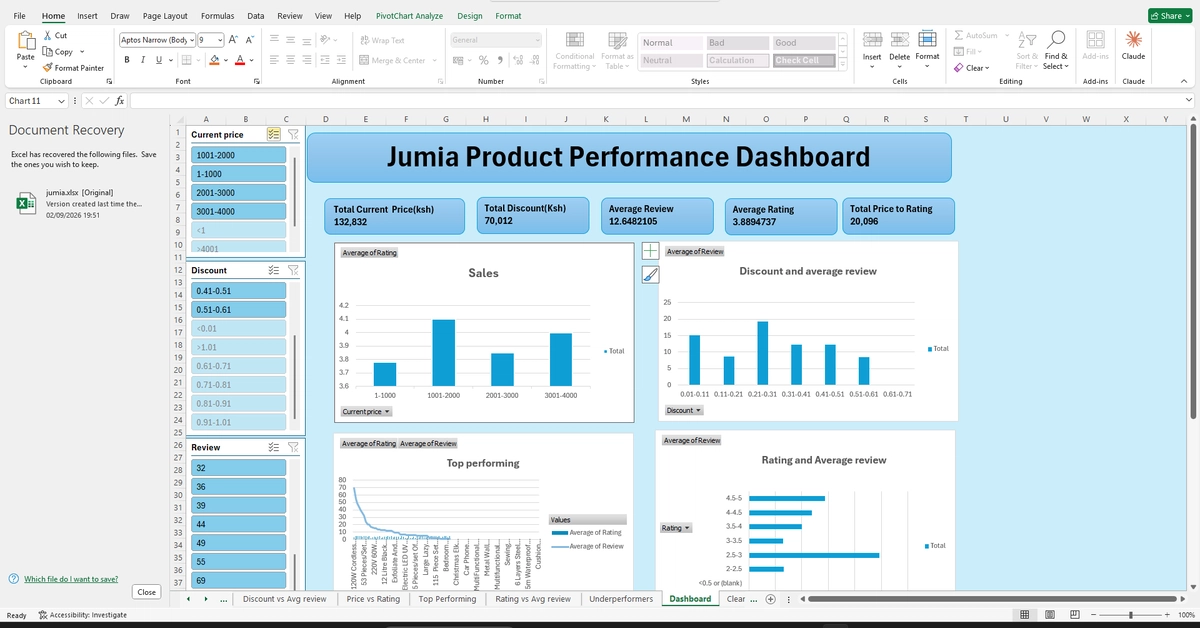
Introduction: Turning Jumia Product Data into Business Insights
E-commerce platforms generate a lot of product data, but raw numbers become useful only when they can support better decisions. For Jumia sellers, prices, discounts, ratings and customer reviews can provide clues about product performance, customer engagement and possible pricing strategies.
For this project, I worked with a dataset of 112 Jumia products to explore these relationships using Microsoft Excel. I wanted to find out whether higher discounts are associated with more customer reviews, whether highly rated products receive stronger engagement, and whether product price is related to rating. I also wanted to identify the products performing best and those that may require a different pricing or marketing approach. I followed a complete data-analysis workflow:
Raw Data → Cleaning → Transformation → Analysis → Visualization → Insights → Recommendations
The project uses Excel Tables, Power Query, formulas and functions, PivotTables, PivotCharts, slicers and dashboard techniques. This article documents that process and shows how the raw Jumia data was transformed into an interactive dashboard and, ultimately, evidence-based business recommendations.