Introduction
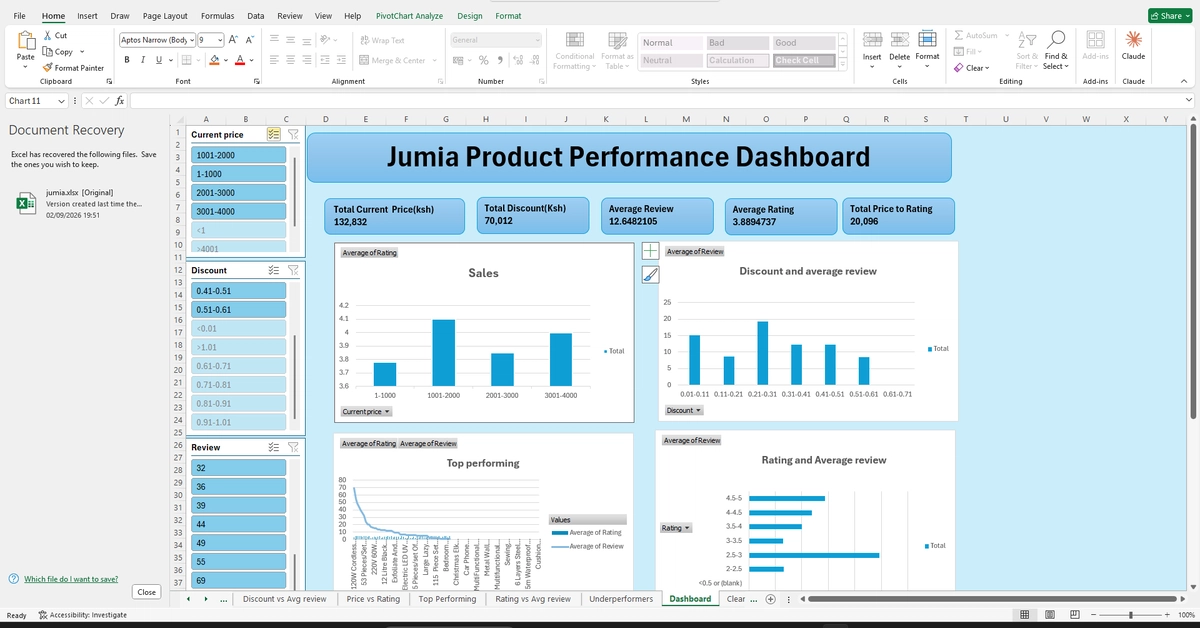
The dataset: 112 products scraped from Jumia Kenya, with fields for current price, old price, discount percentage, review count, and customer rating. The goal was to clean it, analyze it, and turn it into an interactive Excel dashboard with slicers and pivot charts, not just static tables.
Cleaning
Before any analysis, I had to fix:
Prices stored as text — Excel treats "KSh 1,499" as a string, not a number, so no math works until you strip the formatting