As data centers and other large users drove demand higher, U.S. power plants increased their output by 2.1 percent in the first half of the year compared to the first half of 2025.
This week, I looked at which states rose and fell the most and which power sources drove those changes, based on figures from the U.S. Energy Information Administration.
The states that saw the largest increases in utility-scale electricity generation were, in order: Texas, Washington, Tennessee, Ohio and New Mexico. Each has its own story, with solar surging in Texas and different technologies rising in the other states, from hydropower in Washington and nuclear in Tennessee to natural gas in Ohio and a coal-solar combo in New Mexico.
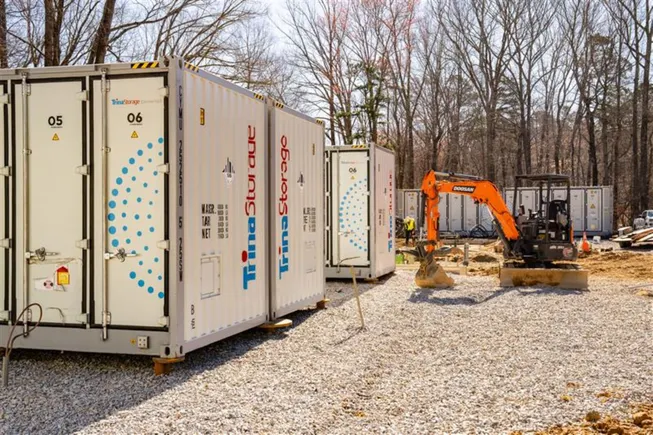
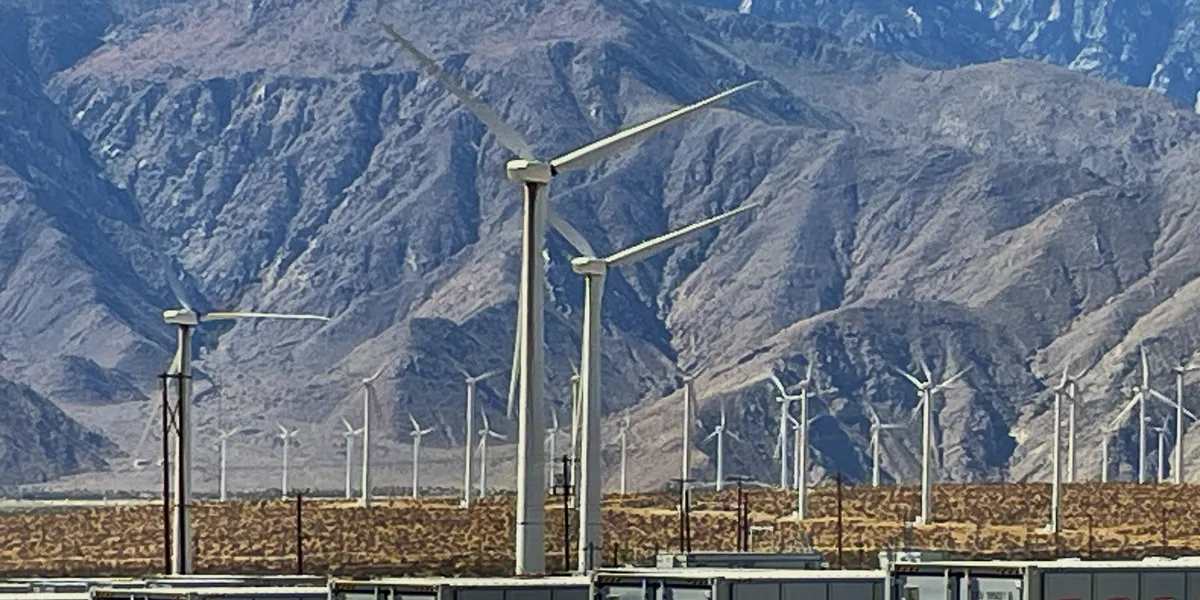
At the other extreme was California, where utility-scale generation plummeted, thanks in part to batteries that allowed the state to store solar power that otherwise would have gone to waste and helped reduce the need for natural gas.
For context, here are some of the national numbers to show which states are moving in step with broader U.S. trends and which are headed in a different direction: Natural gas power plants remained the country’s electricity generation leader, with 38.4 percent of the total in the first half of the year, followed by renewables with 28.5 percent, nuclear with 17.1 percent and coal with 14.4 percent and about 1 percent for “other.”