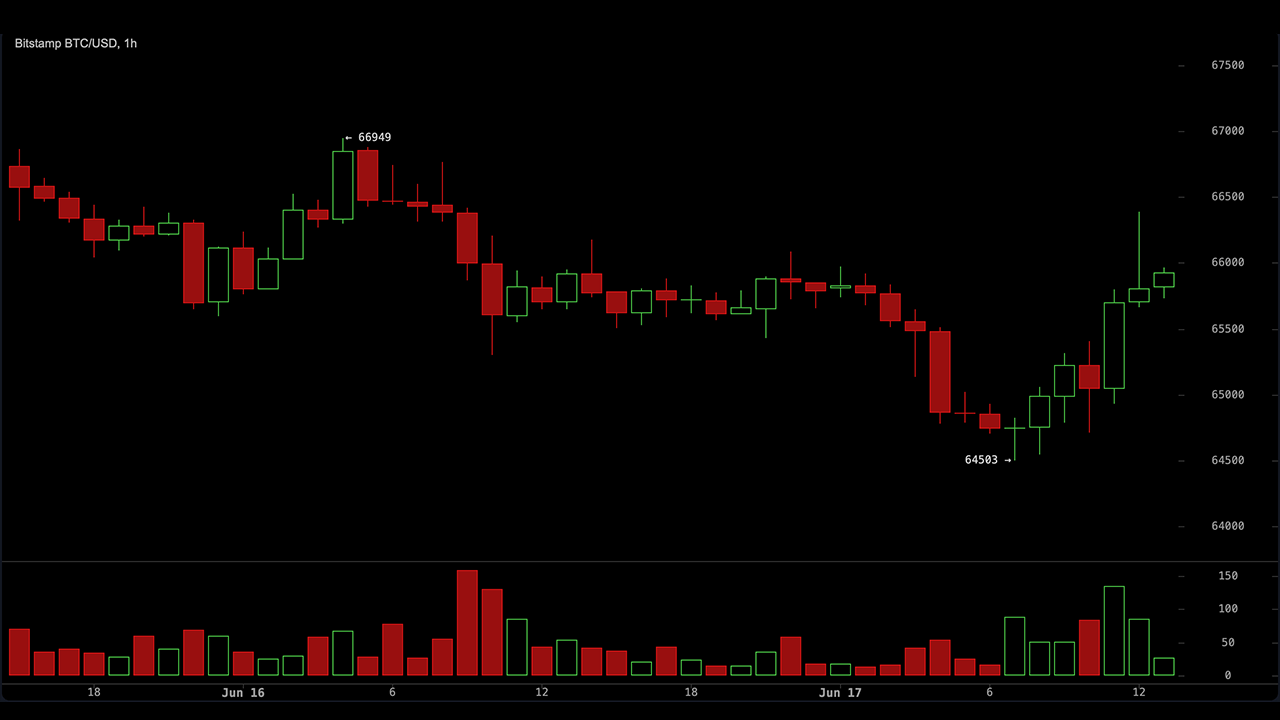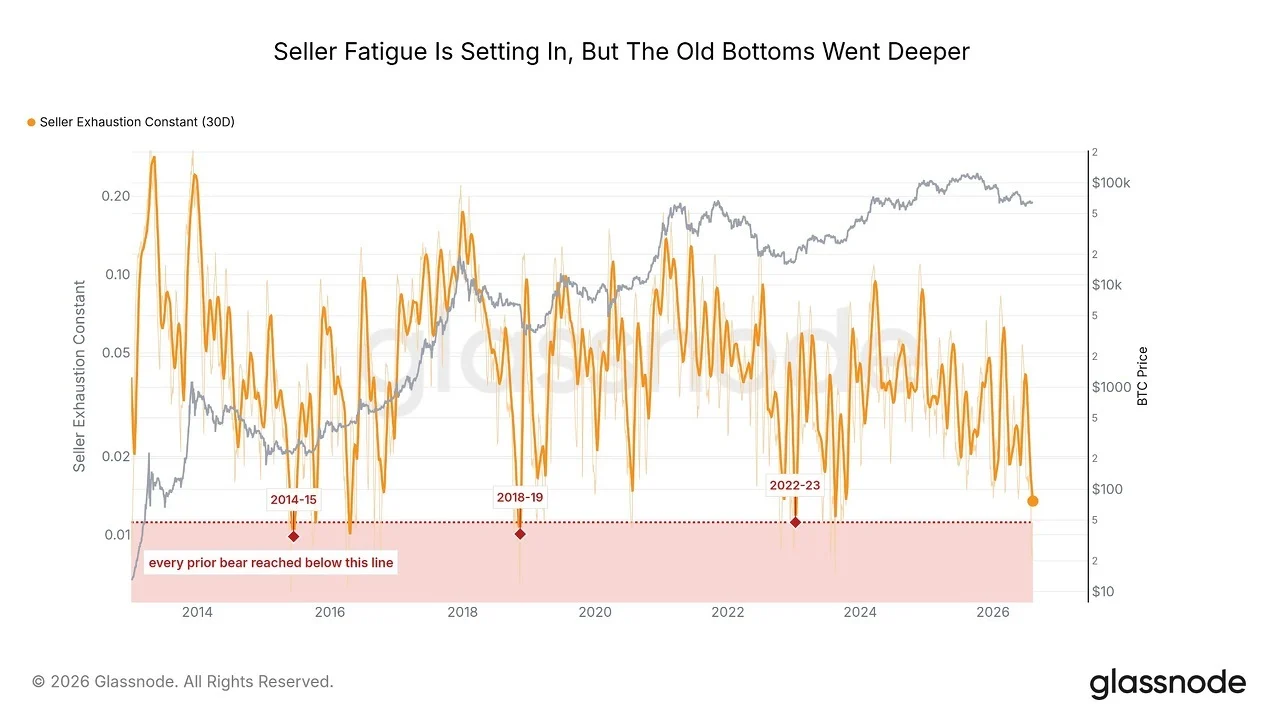
Bitcoin’s price action is telling a very specific story right now, and Glassnode’s on-chain data is providing the footnotes. The analytics firm’s latest reports, “Squeeze into Supply” and “Doubt at the Boundaries,” paint a picture of a market boxed into a well-defined range, with a supportive floor beneath it and a ceiling that keeps getting harder to crack.
The setup traces back to August 19, when Bitcoin experienced its largest single-day short liquidation event in dollar volume since 2019. What followed was a 26% rally that consumed roughly 86% of the available liquidation fuel, leaving a stubborn patch of residual short liquidations between $82K and $86K.
The supply map Bitcoin is trading against
Glassnode’s analysis identifies two key zones anchoring Bitcoin’s current range. On the downside, an accumulation floor sits between $62K and $65K, built up by both long-term and short-term holders who acquired coins at those levels. On the upside, long-term holder supply is densely clustered between $83K and $86K, forming a natural ceiling.
The $81K to $86K range is a convergence point where multiple market dynamics overlap: self-custody cost-basis shelves, dealer gamma flips, and long-term holder breakeven points all intersect within this narrow band.