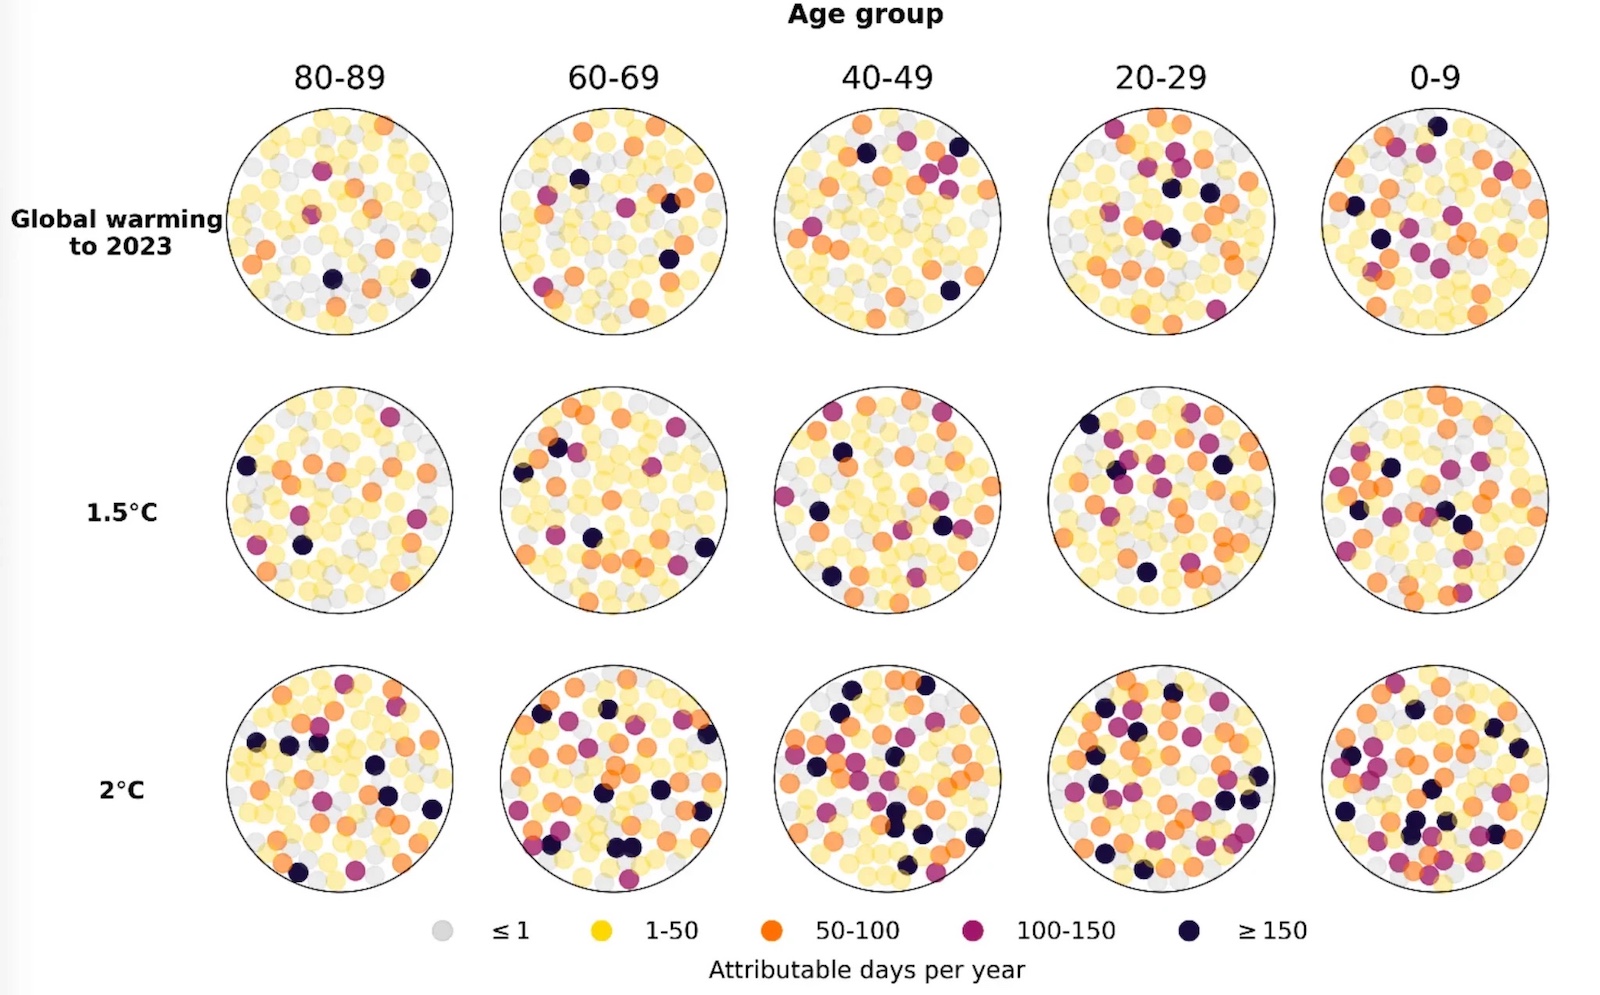
Attributable days of heat stress for different age cohorts (columns), at different warming levels (rows). Each circle contains 100 coloured dots, with each dot representing 1% of the age cohort. Darker dots indicate more heat-stress days. Source: Pietroiusti et al (2026).
Support CleanTechnica's work through a Substack subscription, on Patreon, or on Stripe. Help us produce all of the high-quality, original content we publish week after week despite the challenges of content-scraping AI, antisocial media, inflation, and other hurdles.
By Ayesha Tandon
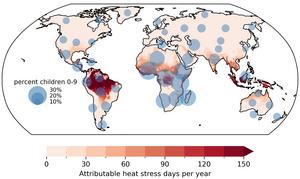
More than 40% of children under the age of 10 globally are already experiencing at least 20 additional “heat-stress days” due to climate change.
This is according to a new attribution study, published in Science Advances, which combines climate models with demographic data to assess the age groups and regions that are exposed to the most hot, humid days.