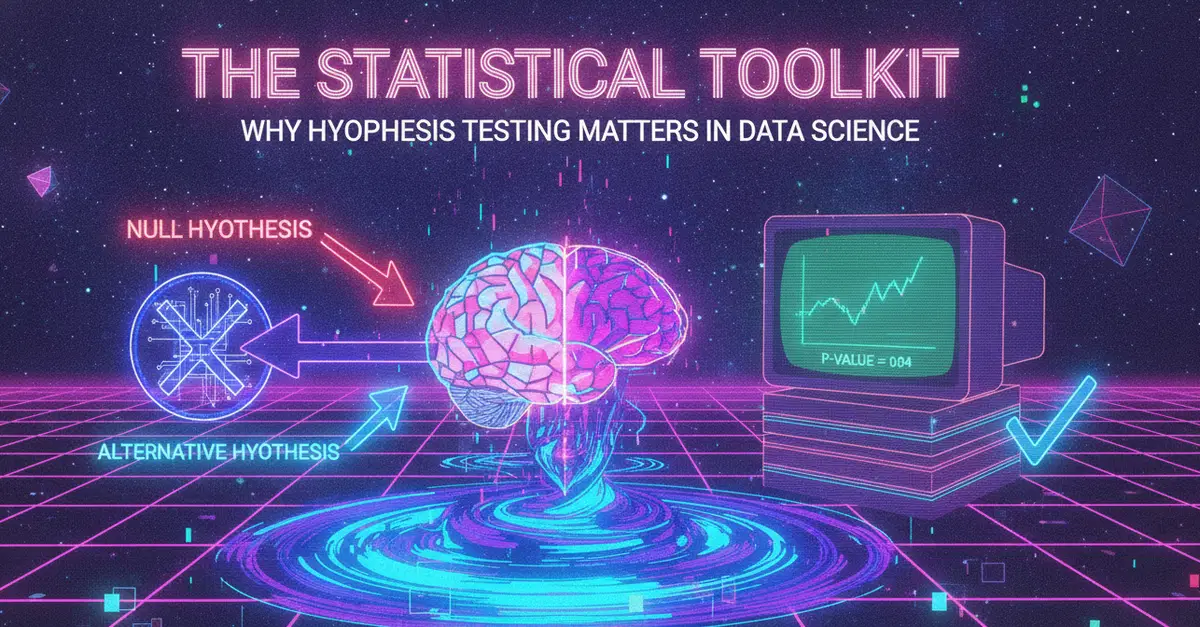
Descriptive stats, probability distributions, confidence intervals, hypothesis testing, and the mistakes that fool experienced engineers.
The Alert That Cried Wolf
A team at a mid-size SaaS company set up monitoring for their API response times. They configured an alert: "Trigger if average response time exceeds 500 ms over a 5-minute window." The alert fired constantly. Engineers sprinted to investigate, found nothing wrong, and started ignoring it. Two weeks later, a genuine outage went undetected for 20 minutes because everyone had learned to dismiss the alert.
The problem was the word "average." The average response time was 350 ms, but the distribution was heavily skewed: 95% of requests completed in under 200 ms, while 5% took over 2 seconds (timeouts and retries). The average hid the tail — the 5% of users having a terrible experience. When the team switched to alerting on the 95th percentile (p95) of response time instead of the mean, the false alarms stopped. The p95 was 450 ms — still healthy — and the tail latency that had been dragging up the average became visible in a separate dashboard.
This is the fundamental lesson of statistics for developers: the summary statistic you choose determines the story you see. Mean, median, and percentile each reveal different truths. Standard deviation tells you whether your system is consistent or erratic. Confidence intervals tell you whether a change is real or noise. Hypothesis testing tells you whether your "improvement" actually improved anything or whether you're just seeing random variation.