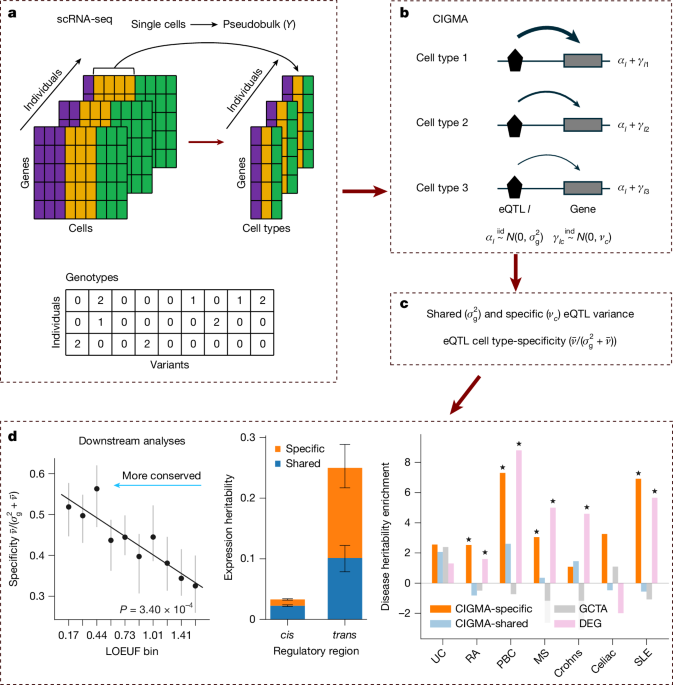
MainThe challenge of connecting genetic effects on complex traits with their underlying gene regulatory mechanisms has motivated population-scale studies of gene expression using RNA-sequencing (RNA-seq) in bulk tissues, such as GTEx2. Although these studies have identified thousands of expression quantitative trait loci (eQTLs) that contribute to variation in transcript abundance, at present, known eQTLs only explain about 10–30% of genetic effects on complex traits5,6. This suggests that gene regulatory effects on complex traits are likely to depend on contexts that are not evident in bulk tissues, such as cell types, environments or developmental stages. Here, we sought to characterize the role of eQTL cell-type-specificity on complex traits.Previous studies have focused on eQTLs that reach statistical significance in bulk tissues, a strategy that, due to limited power, identifies only a small fraction of suspected eQTLs. Furthermore, this strategy biases towards atypically large eQTL effects that are shared across all cell types within a tissue and are depleted in the genetic architecture of complex traits and relevant gene features3. Recently, eQTL studies using single-cell RNA-seq (scRNA-seq) have improved power to identify cell-type-specific eQTLs that are likely to contribute to gene regulatory effects on complex traits7,8,9,10,11. However, these studies also focus on statistically significant eQTLs, leaving the overall role of eQTL cell-type specificity unclear.We propose an alternative approach based on partitioning variation in scRNA-seq data. Rather than identifying individual eQTLs, our model unbiasedly quantifies the overall contributions of cell-type-shared and cell-type-specific eQTLs. Using this approach, we established the importance of cell-type-specific eQTLs in the genetic architecture of complex traits and partly explained why known eQTLs are depleted in functionally relevant gene features.CIGMA quantifies cell-type-specific eQTLsWe set out to characterize cell-type-specific eQTLs by combining recent population-scale scRNA-seq datasets, which greatly improve cell-type resolution over bulk tissues, with statistical genetic models that unbiasedly quantify genetic effects, similar to the genomic-relatedness-based restricted maximum-likelihood (GREML) model of complex trait heritability12.Our approach, cell-type-informed genetic mixed-model analysis (CIGMA), is shown in Fig. 1 (Methods). For a given gene, CIGMA quantifies the variance explained by cell-type-shared eQTLs, \({\sigma }_{{\rm{g}}}^{2}\); the variance explained by eQTLs specific to cell-type c, vc; and the overall eQTL specificity, which we define as \(\bar{v}/({\sigma }_{{\rm{g}}}^{2}+\bar{v})\), where \(\bar{v}\) averages vc across cell types. When all vc = 0, eQTLs are identical across cell types; otherwise, eQTLs are partly cell-type-specific, and we call the gene a cell-type-specific eGene (cs-eGene)9.Fig. 1: Study overview.a, We used population-scale scRNA-seq data and paired genotypes as input. Typically, CIGMA is fit to common cis variants, but it can fit multiple genotype matrices, for example, cis and trans. b,c, CIGMA fits cell-type-shared and cell-type-specific eQTLs (αl and γlc) (b), and then outputs the variance explained by each group (\({\sigma }_{{\rm{g}}}^{2}\) and vc) and eQTL specificity \((\bar{v}/({\sigma }_{{\rm{g}}}^{2}+\bar{v}))\) (c). d, We used CIGMA outputs to characterize how cell-type-specific eQTLs relate to key genomic features, such as conserved genes and complex trait heritability.CIGMA has several key features for robust inference in scRNA-seq data (Methods and Supplementary Note 1). First, CIGMA accounts for cell-to-cell variation (δ) within each individual and cell type, including experimental noise. Second, CIGMA can jointly fit multiple random effects, such as cis and trans genomic regions or experimental batches. Third, our primary analyses assume that cell-type-specific eQTLs are independent across cell types for parsimony, but CIGMA can also fit a more realistic model allowing arbitrary eQTL correlations across cell types. Finally, CIGMA parameters are unbiasedly estimated with the method of moments and nonparametrically tested with jackknife.To assess the ability of CIGMA to quantify the variance explained by cell-type-specific eQTLs, we performed simulations based on peripheral blood mononuclear cells (PBMCs) from OneK1K, which has the most individuals of available scRNA-seq datasets10. After quality control, we included 10,288 genes, 928 individuals, 7 cell types and 1,190 cells per individual on average (Methods and Supplementary Fig. 1). We applied CIGMA to real cis SNPs (within 500 kilobases (kb) of the gene body) for each gene.We established that CIGMA is well calibrated in the absence of eQTLs by permuting genotypes across individuals (Fig. 2a). Next, we asked whether CIGMA is biased by cell-type-shared eQTLs by permuting cells across cell types. As expected, CIGMA detected the cell-type-shared eQTLs yet also provided calibrated null estimates for cell-type-specific eQTLs (Fig. 2a, Extended Data Fig. 1a and Supplementary Fig. 2). These results held across genes passing our quality control regardless of their total levels of expression or variance (Extended Data Fig. 1a). Interestingly, permuting subsets of cell types shows that eQTL specificity is reduced less by mixing cell types within the same lineage (Extended Data Fig. 1b). We found that the Wald test of CIGMA for significant cs-eGenes was calibrated when permuting individuals but slightly inflated when permuting cells, although this was negligible compared with real data signals (Supplementary Fig. 2 and Supplementary Table 1).Fig. 2: CIGMA yields unbiased and powerful estimates of cell-type-shared and cell-type-specific eQTLs in simulations.a, Permutations of real OneK1K data across 10,288 genes. Genotype permutation breaks the connection between genotypes and expression, eliminating all eQTLs. Cell permutation across cell types within individuals renders cell types meaningless while preserving cell-type-shared eQTLs. About 10% of points lie outside the range (−0.2, 0.3) and are not shown. b, Pseudobulk simulations with 1,000 replicates show that CIGMA is unbiased and grows more precise with more individuals. c, CIGMA compared with simpler methods while varying the number of cells relative to OneK1K (which has approximately 1,190 cells per individual) across 1,000 replicates. ‘CIGMA without δ’ ignores cell-to-cell variation by assuming δ = 0 in equation (1) (Methods). ‘GCTA’ is used to fit the standard GREML model, which we apply either to pseudobulk per cell type (CTP) or to overall pseudobulk which combines cells across all cell types (OP). ‘GxEMM’ extends the GREML model to model GxE heritability, which we apply to OP using cell-type proportion as an ‘environment’. ‘BOLT-REML’ extends GREML to multiple traits, which we apply to each cell type as a ‘trait’. The OTD framework applies GREML after partitioning expression into cell-type-shared and cell-type-specific components. The white dots in a represent the medians. The boxes in b represent the first, second (median) and third quartiles, whereas the whiskers extend to values within 1.5 times the interquartile range from the first and third quartiles. Data points beyond the whiskers are outliers. The error bars in c represent the first, second (median) and third quartiles of estimates.Source dataWe next simulated data varying the number of individuals, N, and found that estimates were unbiased for all N and grew more precise as N grew (Fig. 2b and Methods). Power to detect cs-eGenes grew with N, rising from about 40% with N = 1,000 to about 100% with N = 2,000 (Supplementary Fig. 3). Power and precision also grew with the number of cells, the number of cell types and eQTL cell-type specificity (Extended Data Fig. 2, Supplementary Fig. 3 and Supplementary Table 2). We also found that CIGMA is robust to simulations that violate its assumptions on how eQTL effects are distributed across variants or cell types in theory and simulations (Extended Data Fig. 3, Supplementary Figs. 4 and 5 and Supplementary Notes 1.4 and 1.6) and to real genotype data (Supplementary Fig. 6).We compared CIGMA with simpler methods to quantify eQTLs. First, we tested a version of CIGMA that ignores cell-to-cell variation (Methods), which resulted in about 90% deflated estimates of eQTL variance explained with realistic data, although this bias vanished in the limit of infinite cells (Fig. 2c). Second, we tested GREML12, a common approach to quantify genetic effects on complex traits that neither distinguishes shared and specific eQTLs nor models cell-to-cell variation. With infinite cells, GREML unbiasedly estimated total eQTL variance when applied separately to each cell type (cell-type pseudobulk, CTP). However, when applied to a proxy for bulk RNA-seq that sums over cell types (overall pseudobulk, OP), GREML was biased in different directions depending on the number of cells; the mixture preserves cell-type-shared effects but partly cancels cell-type-specific effects, changing the relative strength of genetic and nongenetic variance13 (Methods). Third, we applied GREML to cell-type-shared and cell-type-specific components of expression by applying orthogonal tissue decomposition (OTD), which was downward biased with realistic data and remained biased with infinite cells14 (Methods). Fourth, we tested a multi-trait model, treating the expression of each cell type as a trait (BOLT-REML15), which is similar to CIGMA without cell-to-cell variation and gave similar results. Finally, we applied a GxE model to OP expression treating cell-type proportion as an ‘environment’ (GxEMM16), which also gave similar estimates on average, although they were much noisier because GxEMM uses less informative data (OP instead of CTP). GxEMM and BOLT-REML yielded biased specificity estimates due to unmodelled cell-to-cell variation (Supplementary Fig. 7). Overall, existing methods for complex traits cannot quantify cell-type-specific eQTLs in realistic scRNA-seq data because of cell-type-shared eQTLs and/or cell-to-cell variation.Cell-type-specific eQTLs in OneK1KWe analysed 928 individuals and the seven most common cell types from the OneK1K scRNA-seq dataset10. We applied CIGMA to common cis SNPs for each of 10,288 genes, defined as SNPs within 500 kb of the gene body with minor allele frequency (MAF) greater than 5% (ref. 14). We detected cell-type-specific eQTLs for 193 genes (P < 0.05/10,288; Fig. 3b and Supplementary Fig. 8 and Supplementary Table 3), which we call statistically significant cs-eGenes. Ninety-seven of these genes do not have significant cell-type-specific residual interindividual variance, highlighting the ability of CIGMA to distinguish genetic variation. Of these 193 significant cs-eGenes from jointly testing all cell types, 64 were individually significant in two or more cell types (P < 0.05/10,288; Supplementary Fig. 9). These numbers represent conservative lower bounds as cs-eGene detection depends on power. We summarize the transcriptome-wide distribution of CIGMA estimates in Supplementary Fig. 10.Fig. 3: Quantifying cell-type-shared and cell-type-specific eQTLs in OneK1K.a, Transcriptome-wide median cell-type-shared and cell-type-specific heritabilities in cis and trans. A subset of 9,065 genes with positive combined genetic and environmental variances were included (Methods and Extended Data Fig. 4). Error bars represent 95% confidence intervals based on bootstrapping genes. b, Tests of cell-type-specific genetic (v = 0, two-sided Wald test) and residual interindividual (w = 0, two-sided Wald test) effects across 10,288 genes. Dashed lines show Bonferroni-corrected significance (P = 4.9 × 10⁻⁶). Stars indicate significant cs-eGenes that do not have significant cell-type-specific residual interindividual variance. c,d, Estimated cell-type-shared and cell-type-specific genetic variances for CTLA4 and SMDT1. Error bars represent estimated variances ±1 s.e. Total genetic variance in each cell type c is \({\sigma }_{{\rm{g}}}^{2}+{v}_{c}\), which is positive for these genes. P-values are from b. e, Cell-type specificity increases with distance from the transcription start site (TSS). CIGMA was fit using window sizes ranging from 5 kb to 2 Mb. The plot includes mean variances and median specificity across 4,625 genes with positive combined shared and specific genetic variances (\({\sigma }_{{\rm{g}}}^{2}+\bar{v}\)) in all windows. Error bars represent 95% confidence intervals based on bootstrapping genes. f, Transcriptome-wide heritabilities per cell type (diagonal) and genetic and residual interindividual correlations across cell types (lower and upper triangles, respectively; Methods) for 10,288 genes.Source dataFor example, one cs-eGene, CTLA4, encodes an inhibitory receptor downregulating T cell response (Fig. 3c). Cell-type-specific eQTLs in CTLA4 have previously been linked to multiple immune diseases10,17. Another cs-eGene is SMDT1, which regulates calcium uptake in mitochondria. This gene has a known eQTL that is specific to monocytes at particular time points after pathogenic stimulation18. Our significant cs-eGenes almost perfectly overlap those detected by a fixed-effect test for cell-type-specific eQTLs in the same data, although the latter detected more genes11 (Supplementary Fig. 11). We conclude that cs-eGenes can recover genes with known cell-type-specific eQTLs that are relevant to complex diseases.We compared eQTL cell-type specificity with differential expression across cell types, a standard measure of cell-type specificity that does not consider variation across individuals. We expected these measures to partly overlap because cell-type-specific eQTLs can cause differential expression10. We found that cs-eGenes and differentially expressed genes (DEGs) have a weak but significant overlap (14 of the top 200 cs-eGenes and DEGs overlap, Spearman ρ = 0.19 between \(\bar{v}\) and variance across cell types; Supplementary Fig. 12). This confirmed that cell-type-specific eQTLs contribute to differential expression across cell types.We next explored CIGMA’s generalized model of eQTL covariance across cell types. Although noisy at this sample size, eQTL sharing across cell types recovered known relationships (Fig. 3f). For example, the two B cell subtypes, BIN and BMem, had high eQTL correlation. We found a similar pattern for residual interindividual covariances across cell types (correlation with eQTL covariance is r = 0.95; Supplementary Fig. 13), showing that cell types generally have similar responses to cis genetic and other interindividual effects. Importantly, our primary results from the simpler model of CIGMA are not biased by this more complex form of eQTL covariance (Extended Data Fig. 3 and Supplementary Note 1.4).We jointly quantified cis and trans eQTLs, in which trans is defined to include variants on other chromosomes. Bulk RNA-seq studies have shown that cis eQTLs are more shared across tissues than trans2,13. We found a similar pattern across cell types: cis eQTLs are mostly shared (31.1% specific, standard error (s.e.) 1.3%), whereas trans are mostly specific (59.4% specific, s.e. 4.6%; Pdiff = 0.001, 1,000 permutations, one-sided test). The median gene expression heritability from trans eQTLs is 25% (s.e. 2.1%), much higher than the 3% from cis eQTLs (s.e. 0.1%; Fig. 3a and Supplementary Table 4). These results are robust to using means rather than medians (Extended Data Fig. 4) or to changing quality control thresholds (Extended Data Fig. 4 and Supplementary Fig. 14), covariate modelling assumptions (Supplementary Figs. 15–17), number of genetic PCs (Supplementary Fig. 18), pseudocount used to construct pseudobulk (Supplementary Fig. 19) or MAF filter (Supplementary Fig. 20).Known eQTLs that are more distal from the TSS are more specific across developmental time points19 and environmental exposures20. To test how eQTL specificity varies with distance to TSS, we fit CIGMA with varying cis window sizes. As expected, we found that eQTL cell-type specificity increased with window size, dropping to 30% when we reduced to 5 kb and rising to 41% when we increased to 1 Mb (Fig. 3e).We analysed a proxy for bulk tissue RNA-seq we call OP, which sums over all cells per individual regardless of cell type. We found that cis eQTLs are 5% cell-type-specific in OP (Supplementary Fig. 21), far below the 30% specificity we observed within each cell type (Fig. 3a). This deflation of specificity is expected because bulk tissues mix cell types13 (Methods, Fig. 2c, Extended Data Fig. 1b, Supplementary Note 1 and Supplementary Table 5). Consequently, because trans eQTLs are more specific than cis, the trans:cis ratio is deflated in OP (83% trans) relative to each cell type (88% trans; Pdiff = 0.005, 1,000 permutations, one-sided test). Overall, our results quantified how bulk tissues bias eQTLs towards cis effects that are shared across cell types.eQTL specificity and gene featuresWe compared eQTL specificity with gene features that are enriched in complex traits but depleted in known eQTLs. Based on previous work, we hypothesized that genes with more specific eQTLs would have more evolutionary constraint, enhancers and gene network connections3 (Methods). Our results supported this hypothesis.First, we tested evolutionary constraint using loss-of-function observed/expected upper bound fraction (LOEUF)21. We found that more-constrained genes had lower cell-type-shared and cell-type-specific cis genetic variances, consistent with bulk eQTLs3,4,5,13,14,22,23. By contrast, we found that more-constrained genes had higher eQTL specificity (Fig. 4a), consistent with the hypothesis that more pleiotropic variants experience stronger selection24. Second, we found that genes with higher eQTL specificity had more enhancers (Fig. 4a), consistent with observations that more complex regulatory landscapes facilitate more specific expression across tissues25. Third, we examined gene network connectedness and found that shared eQTLs were less connected; as in ref. 3, this was driven by a marked enrichment in the least-connected gene decile (P = 1.9 × 10⁻⁵; Fig. 4a and Supplementary Table 6). Finally, we found that eQTL specificity decreased with average expression level and increased with gene length and differential expression across cell types (Supplementary Fig. 22). Nonetheless, adjusting for these features did not affect our conclusions (Extended Data Fig. 5), nor did changing quality control filters on CIGMA estimates (Supplementary Fig. 23), total expression (Supplementary Figs. 24 and 25), MAF (Supplementary Fig. 26), or the number of included cell types (Supplementary Fig. 27). Because bulk eQTLs are biased towards cell-type-shared effects, these results partly explain why known eQTLs are depleted in these gene features3.Fig. 4: Genomic properties of cis eQTLs and cell-type specificity in OneK1K.a, Shared and specific eQTL strengths binned by deciles of the transcriptome based on LOEUF, enhancer counts and gene network connectivity. In total, 7,042 genes were included, of which 6,996, 7,028 and 3,828 had measured LOEUF, enhancer counts and connectivity, respectively (Methods). Points show means (top) or medians (bottom); error bars show 95% bootstrap confidence intervals; and x-axis ticks show median gene feature values. P-values come from meta-regression (two-sided t-test; Supplementary Table 6). For ‘connected rank’, the meta-regression P-value is insignificant, but the mega-regression gives P = 1.9 × 10⁻⁵ (two-sided t-test; Supplementary Table 6), and the asterisk indicates shared eQTLs are enriched in the least-connected decile (P = 6.7 × 10⁻¹¹, two-sided t-test). b, Complex trait heritability enrichment for the top 200 cs-eGenes, shared eGenes, bulk eGenes, and DEGs. Asterisks indicate P ≤ 0.05 (one-sided z-test), and P-values are provided in Supplementary Table 9; vertical line splits less-blood-related and blood-related traits. CAD, coronary artery disease; SCZ, schizophrenia; UC, ulcerative colitis; RA, rheumatoid arthritis; PBC, primary biliary cirrhosis; MS, multiple sclerosis; SLE, systemic lupus erythematosus. c, GO terms that significantly differ across quartiles of eQTL specificity in 4,250 genes with positive cis genetic variance components (\({\sigma }_{{\rm{g}}}^{2}\) and \(\overline{v}\), one-sided hypergeometric test); see Supplementary Table 7 for all 19 significant GO terms after adjustment for multiple comparisons.Source dataWe next tested these enrichments in residual interindividual variance components. We found that shared and specific residual interindividual variance shrink with constraint and grow with gene network connectivity, with no clear relationship to specificity, whereas the cell-type-specific component sharply grew with the number of enhancers (Supplementary Fig. 28). This may be explained by nongenetic and/or unmodelled trans variants (Supplementary Fig. 29), but we were underpowered to address this.We asked what other properties distinguish genes with higher cis eQTL cell-type specificity. First, we assessed Gene Ontology (GO) terms and found that low-specificity eGenes were enriched in one term, ‘cytoplasmic translation’, whereas high-specificity eGenes were significantly enriched in 19 terms that all directly relate to immune cells26 (Fig. 4c and Supplementary Table 7). These enrichments add confidence that eQTL specificity indexes cell-type-specific biology. Second, we considered drug target genes defined by OpenTargets27, which were depleted in shared and specific eQTL variance without clear relationship to specificity. Third, we found the same results for genes with burden scores associated with disease risk28 (Extended Data Fig. 6). Fourth, we used candidate cis-regulatory elements (cCREs)29 from five immune cell types to define cCREs open in one cell type (unique) or in all five (common). As expected, the top DEGs were enriched in unique cCRE (1.2-fold, P = 0.001) and depleted in common cCRE (0.7-fold, P < 0.001; Extended Data Fig. 7 and Supplementary Table 8); cs-eGenes showed a similar but weaker pattern (respectively, 1.1-fold (P = 0.47) and 0.8-fold (P = 0.0052)), whereas cell-type-shared eGenes did not.Specific eQTLs underlie complex traitsHaving established that eQTL specificity enriches for gene features that are relevant to complex traits, we directly tested their enrichments in genetic effects on complex traits. We applied linkage disequilibrium score regression (LDSC) to test enrichment of the top 200 cs-eGenes in 10 complex traits9,30 (Methods). We found that cs-eGenes were enriched for 4/7 blood-related traits and 0/3 less-blood-related traits (P ≤ 0.05; Fig. 4b and Supplementary Table 9). These enrichments were comparable to the enrichments for the top 200 DEGs, a standard approach to measure cell-type-specific heritability based on gene expression30. We found no enrichments for complex trait heritability in the top 200 cell-type-shared eGenes, as defined by the \({\sigma }_{{\rm{g}}}^{2}\) parameter of CIGMA, or the top 200 bulk eGenes, as defined by applying GCTA to OP expression. We confirmed these results were robust to gene set size (100 or 300 genes), window size (300 kb and 700 kb, Supplementary Fig. 30 and Supplementary Table 10), and MAF filter (Supplementary Fig. 26 and Supplementary Table 10). Our primary LDSC test compares with matched random genes for robustness (Methods, Supplementary Fig. 31 and Supplementary Table 10), but we find consistent results using the standard LDSC with or without adjusting for DEGs (Supplementary Fig. 32 and Supplementary Table 10).We next asked if CIGMA could implicate disease-causal cell types by testing disease heritability enrichment in significant cs-eGenes per each cell type (Supplementary Fig. 9). Using the same LDSC approach, we found six cell-type-trait enrichments (q < 0.1, Supplementary Table 11 and Supplementary Fig. 33). For example, we found that CD4ET cells enrich for Crohn’s disease and ulcerative colitis (UC) heritability31 and that CD8ET cells and NK cells enrich for systemic lupus erythematosus (SLE) heritability. Although CD4 cells are sharply depleted in SLE, CD8 effector T cells may play a greater part in SLE progression32,33,34 and genetic risk9,35.We then used the abstract mediation model6 to quantify the complex trait heritability mediated by these gene sets. We found that the top 200 cs-eGenes mediate 9.0% heritability of blood-related traits, a five-fold enrichment compared with other genes (P = 0.003), whereas the top 200 DEGs, cell-type-shared eGenes and GCTA eGenes mediated only 4.9% (P = 0.004), 3.1% (P = 0.035) and 3.1% (P = 0.010), respectively (Extended Data Fig. 8 and Supplementary Table 12).We concluded that cs-eGenes enrich for heritability in relevant complex traits, comparable to and distinct from DEGs, unlike shared eGenes.eQTL specificity in CLUES and ImmVarWe performed replication analyses in a second population-scale scRNA-seq dataset from California Lupus Epidemiology Study (CLUES) and Immune Variation Project (ImmVar). CLUES contains 1.2 million PBMCs from a combination of patients with SLE and healthy controls9. To mitigate potential confounding, we meta-analysed three subgroups: 75 patients of Asian ancestry with SLE, 70 patients of European ancestry with SLE and 70 controls of European ancestry without controls. Owing to the lower sample size, we had power only to study cis eQTLs in this dataset.The median heritability of gene expression due to cis eQTLs was 4% in CLUES (s.e. 0.3%; Fig. 5a and Supplementary Table 13), similar to the 3% estimate in OneK1K (Pdiff = 0.001, 1,000 permutations, two-sided test), but CLUES exhibited greater specificity than OneK1K (63% compared with 34%; Pdiff = 0.001, 1,000 permutations, two-sided test). These results were consistent across all three CLUES subgroups (Extended Data Fig. 9). Next, as in OneK1K, we found that genes with more cell-type-specific eQTLs had greater evolutionary constraint, more enhancers and higher gene network connectivity (Fig. 5d and Supplementary Fig. 34). These results were consistent in the joint analysis across individuals in all three subgroups (Supplementary Fig. 35 and Supplementary Table 14).Fig. 5: Replicating properties of cis eQTL specificity in CLUES and ImmVar.a, Median cell-type-shared and cell-type-specific cis heritabilities across 10,553 genes (Methods). Error bars represent 95% confidence intervals based on bootstrapping genes. b, −log10(P)-values for cell-type-specific genetic and residual interindividual effects across 10,553 genes (two-sided Wald test). Dashed lines show Bonferroni significance (P = 4.7 × 10⁻⁶). The −log10(P)-values are capped at 20 for visibility. c, Comparison of cs-eGene P-values between OneK1K (Fig. 3b) and CLUES across 9,888 genes. d, Shared and specific eQTL strengths binned by deciles of the transcriptome based on LOEUF, enhancer counts and gene network connectivity. In total, 2,325 genes were included, of which 2,310, 2,324 and 1,300 genes had measured LOEUF, enhancer counts and connectivity, respectively. Points show means (top) or medians (bottom); error bars show 95% bootstrap confidence intervals; and x-axis ticks show median gene feature values. P-values come from meta-regression (two-sided t-test), and the asterisk in the ‘connected rank’ panel indicates shared eQTLs are enriched in the least-connected decile (P = 4 × 10⁻⁵, two-sided t-test).Source dataWe then compared eQTL estimates per gene between CLUES and OneK1K. Although CLUES had power only to identify four cs-eGenes, three of them overlap OneK1K cs-eGenes (Fig. 5b,c, Supplementary Fig. 36 and Supplementary Tables 3 and 13). More broadly, we found that OneK1K cs-eGenes were highly enriched for small cs-eGene P-values in CLUES (36/183 have P < 0.05, binomial P = 4 × 10⁻¹³), unlike the remaining genes (57/9,705 have P < 0.05, binomial P = 1). Finally, we compared eQTL estimates per gene across OneK1K, CLUES and CLUES subgroups. We found that \({\sigma }_{{\rm{g}}}^{2}\) and \(\bar{v}\) were significantly correlated across all comparisons (all P < 1 × 10⁻¹⁶; Supplementary Table 15 and Supplementary Figs. 37–39), with an average correlation of 0.27. These correlations were not significantly below 1 after accounting for estimation error (all P > 0.05/6; Methods). We conclude that eQTL specificity in PBMCs is a robust gene feature that is broadly consistent across ancestries, health states and datasets.DiscussionA leading theory to explain the limited overlap between known eQTLs and genetic effects on complex traits is that known eQTLs are primarily large effects that are shared across cell types, but complex traits are primarily driven by weak eQTLs that are cell-type specific3,36. Our unbiased quantification of eQTLs using single-cell RNA-seq supports this hypothesis: cell-type-specific eQTLs are enriched in key gene features and complex trait heritability, unlike cell-type-shared eQTLs. This suggests that the missing gene regulation underlying complex traits, like the missing heritability of complex traits12,37, will be primarily explained by eQTLs that are not individually detectable without massive sample sizes38. We also established that eQTL cell-type specificity is a robust gene feature that is about two-fold enriched in trans compared with cis regulation and is associated with distal cis regulation, higher selective constraint, more enhancers and greater gene network connectivity.Unlike standard eQTL studies that seek individual SNP effects, CIGMA quantifies variance explained by eQTLs in a set of SNPs. CIGMA has disadvantages: its estimates are noisier, it cannot colocalize GWAS hits39,40,41, and it does not account for non-Gaussianity42,43,44 or complex cell type relationships45. But CIGMA eliminates biases from uneven eQTL detection power, which deplete known eQTLs in tissue-specificity and cell-type-specificity, enhancers, distance to TSS and fitness relevance3,46,47. These biases from detection power are also reduced in known eQTLs that are context-specific11,22,23, non-primary effects in a locus48,49,50 or identified in individual cell types9,10,51.Our approach has limitations. First, our use of pseudobulk data ignores eQTL variation within cell types, decreasing estimates of genetic variance and specificity (Extended Data Fig. 1b). We expect that finer cell-type partitions or continuous cell states will further enrich eQTL specificity in complex trait heritability based on population genetic theory24 and previous eQTL studies8,41,52,53,54. Second, cell-type-specific eQTLs can depend on measurement scale55, but this is unlikely to affect our conclusions: we confirmed our results on two scales; we controlled for differential expression across cell types; and confounding by shared eQTLs would only conservatively bias eQTL specificity. Finally, we did not study case–control differences in eQTL specificity in CLUES, which could help identify key disease genes and cell types56.MethodsCIGMAWe developed CIGMA to unbiasedly quantify cell-type-shared and cell-type-specific eQTLs in scRNA-seq data. CIGMA avoids bias from eQTL detection power by using a linear mixed model, similar to the GREML model of complex trait heritability12. CIGMA models cell-type-specific pseudobulk data, which is computed by averaging across all cells in predefined cell types, one gene at a time. Mathematically, CIGMA models eQTL l in cell type c as the sum of a cell-type-shared effect (αl) and a cell-type-specific effect (γlc):$${Y}_{{ic}}={\mu }_{c}+\mathop{\sum }\limits_{l=1}^{L}{G}_{{il}}\,({\alpha }_{l}+{\gamma }_{{lc}})+{e}_{{ic}}+{{\epsilon }}_{{ic}}$$
Cell-type-specific eQTLs underlie the genetic architecture of complex traits - Nature
Single-cell RNA-sequencing shows that cell-type-specific expression quantitative trait loci drive much of complex trait heritability, highlighting cell-type-specific gene regulation as key to linking genetic variants with traits.
11,768 words~53 min read