Why I Built a Windows Debugger From Scratch (Because I Wanted to Understand Crashes, Not Just Catch Them)
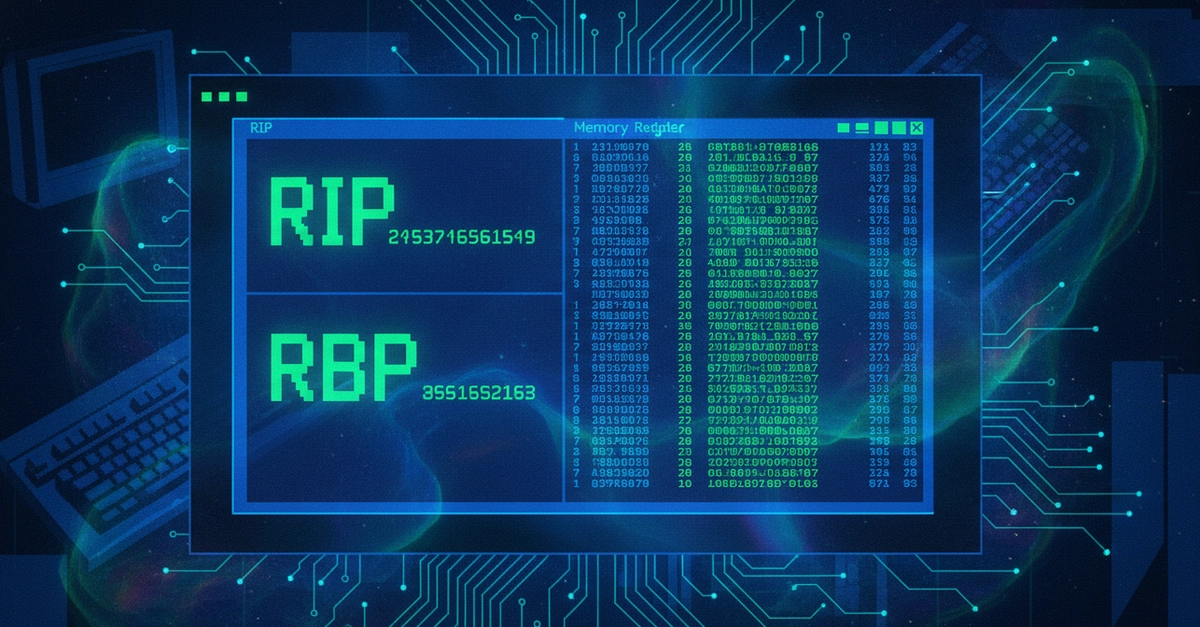
A few months ago I got tired of alt-tabbing between WinDbg, a notepad full of scratch notes, and a Python script that tried (badly) to parse register dumps. I wanted something that just showed me what was happening the moment a target crashed — live, without ceremony. So I built expl0itra, a small Windows binary debugger with a Flutter GUI on top of a C++ debug engine.
To be upfront: this is a small side/fun project, not a production tool. I built it mostly to get my hands dirty with the Windows Debug API while I dig deeper into cybersecurity — specifically software development, driver development, and binary exploitation. If you've built something similar or see an obvious way to make this better, I'd genuinely love to hear it in the comments.
What it actually does
expl0itra wraps the Windows Debug API around any .exe you point it at: