How to Use AI to Debug a Stack Trace (Step-by-Step)
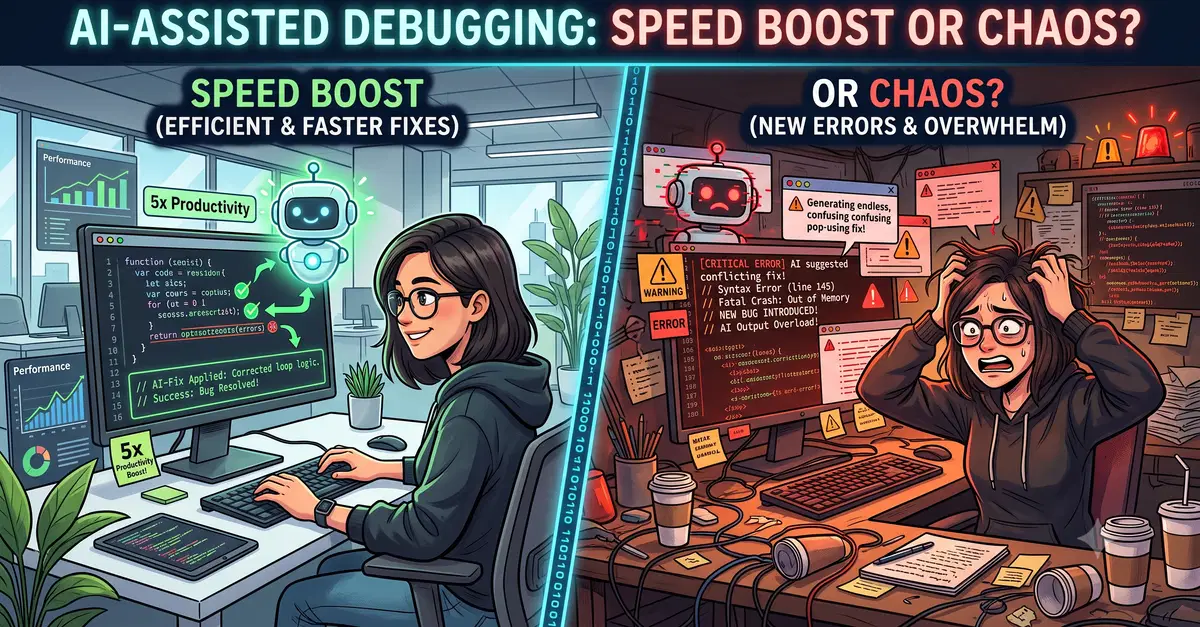
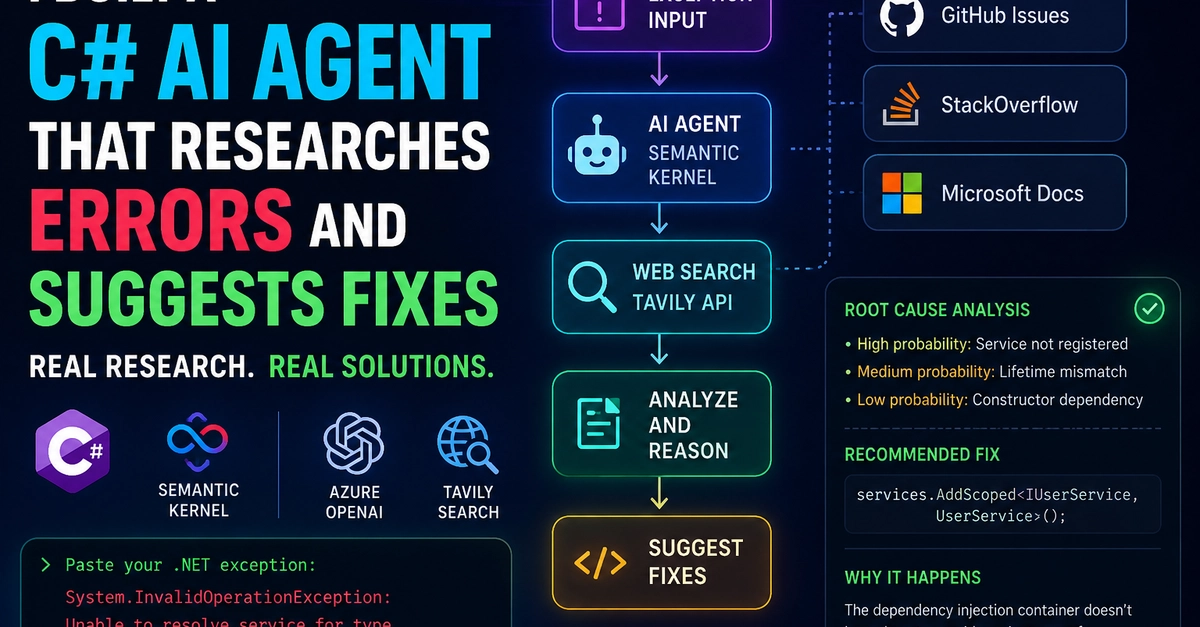
You've got a wall of red text, a stack trace you don't fully recognize, and no obvious starting point. AI can turn that trace into a clear diagnosis and a fix — in under two minutes. Here's exactly how to do it.
Why Raw Stack Traces Are Hard to Parse Alone
Stack traces are dense. They mix your code with framework internals, third-party library frames, and sometimes async noise that obscures the actual origin of the error. The mental overhead of filtering signal from noise is where most debugging time gets wasted. AI is surprisingly good at this — not because it "knows" your system, but because it can pattern-match against thousands of similar traces and explain each layer in plain language.
Step 1: Copy the Full Stack Trace — Don't Trim It