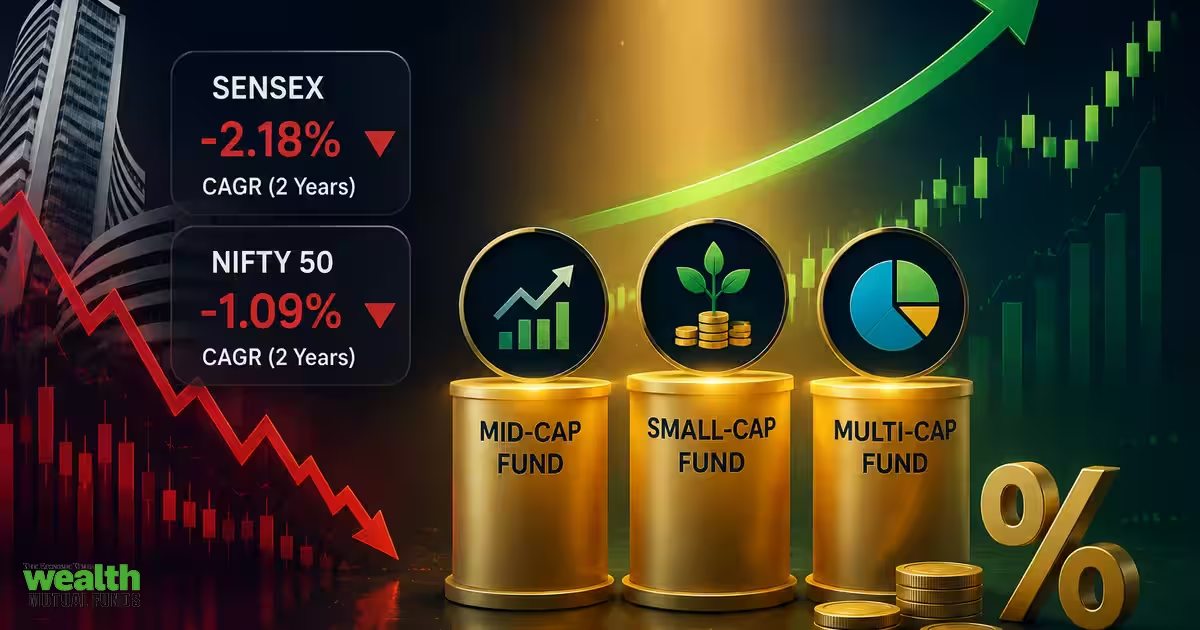
A near-flat Nifty concealed anything but a flat market over the past two years. While the Nifty 50 delivered an annualised price return of just 0.4 per cent and 1.7 per cent on a total-return basis, individual equity mutual fund returns ranged from a 10 per cent loss to a 20 per cent gain.The two years ended August 10, 2026, were marked by sharp corrections, rapid shifts in market leadership and wide divergences across segments. Mid- and small-caps outpaced large-caps, with the Nifty Midcap 150 TRI and Nifty Smallcap 250 TRI delivering annualised returns of 6 per cent and 3.5 per cent, respectively. Sector leadership changed hands repeatedly as risk appetite ebbed and flowed.For equity fund managers, this made portfolio positioning and stock selection critical. Some schemes protected capital better during corrections and captured subsequent opportunities, while others suffered deeper drawdowns and weaker recoveries.A bl.portfolio analysis of 449 actively-managed equity mutual fund schemes shows just how divided the field was: 232 funds, or 52 per cent, beat their respective benchmarks during the period. The wide dispersion in returns shows how dramatically investor outcomes differed despite the market’s subdued headline performanceThe detailed category-wise analysis later in the article focuses on large-cap, mid-cap, large & mid-cap, flexi-cap, small-cap and multi-cap funds.It looks beyond returns to drawdowns, risk-adjusted performance and investor experience through both lump-sum and SIP investments, highlighting which strategies dealt with this deceptively-flat market most effectively.At bl.portfolio, we generally refrain from issuing recommendations on funds with less than seven years of performance history for equity and hybrid funds and five years for debt funds. Therefore, this two-year analysis is not intended as a recommendation or a definitive assessment of these funds. Instead, it offers a perspective on how active equity funds behaved in the market environment, positioned their portfolios and performed against peers and benchmarks.Returns are compounded annualised growth rates (CAGR) for the two years ended August 10, 2026.Key trendsMixed bagJust over half of active equity funds outperformed their respective benchmarks during the two-year period. But category-wise performance reveals a wide divergence in the ability of active funds to generate alpha.Among diversified categories, multi-cap funds led, with 73 per cent of schemes outperforming, followed by flexi-cap at 67 per cent and small-cap at 64 per cent. Focused funds also recorded a strong 61 per cent outperformance rate. At the other end, large-cap funds had a more modest 45 per cent, while value and ELSS stood at 38 per cent and 36 per cent, respectively.Investor takeaway: Active management worked best where fund managers had greater flexibility to exploit sectoral and stock-level opportunities. Outperformance rates varied sharply across categories, showing that fund selection and portfolio positioning mattered far more than the headline index return.Larger funds glitterLarger funds showed a clear edge in benchmark outperformance during the period. Among schemes with assets of more than ₹50,000 crore, 10 of 13, or 77 per cent, beat their respective benchmarks. Parag Parikh Flexi Cap, HDFC Flexi Cap, HDFC Mid Cap, ICICI Prudential Large Cap and Kotak Midcap were among the notable outperformers. However, even this group had laggards, including Nippon India Small Cap, ICICI Prudential Value and Nippon India Multi Cap.The advantage was less evident among smaller funds. Among schemes with less than ₹10,000 crore in assets, only 49 per cent outperformed their benchmarks. Yet, several smaller funds delivered a striking alpha. Motilal Oswal Small Cap returned 15 per cent against 3.5 per cent for its benchmark, while Motilal Oswal Multi Cap and Union Small Cap also outperformed. In contrast, Samco Flexi Cap, Quant Mid Cap and NJ Flexi Cap significantly lagged their benchmarks.Investor takeaway: Many large funds managed to navigate their scale effectively and outperform. However, the wide dispersion within both large and small funds makes one point clear: Size can influence execution, but it cannot replace stock selection, portfolio construction and fund management discipline.SIP scores over lump-sumTwo-year SIP XIRRs were higher than lump-sum CAGRs across almost all equity fund categories. However, the two measures are not strictly comparable: SIP XIRR reflects staggered investments, while lump-sum CAGR assumes the entire amount was invested at the start.The advantage was particularly striking in categories including Small Cap. Motilal Oswal Focused, Bank of India Small Cap, Quant Large & Mid Cap and Quant ELSS Tax Saver delivered SIP returns that were 10-15 percentage points higher than their respective lump-sum returns.However, the benefit was not uniform. Motilal Oswal Large Cap, Parag Parikh ELSS Tax Saver and Parag Parikh Flexi Cap saw a much narrower gap between the two approaches, reflecting relatively lower volatility or a less favourable sequence of market movements for systematic investors.The data highlight an important lesson: In volatile, range-bound markets, the journey matters as much as the destination. Regular investing allows investors to buy more units when prices fall, allowing SIPs to benefit from market volatility.Winning by losing lessThe two-year period shows that outperformance was not always about chasing market rallies. Some funds added value by participating adequately in rising markets while protecting capital better during declines. This is where upside and downside capture ratios become useful.The upside capture ratio measures how much of the benchmark’s gains a fund captured during rising markets. A ratio above 100 means the fund gained more than its benchmark, while a ratio below 100 indicates lower participation.The downside capture ratio measures how much of the benchmark’s losses a fund suffered during falling markets. Here, lower is better. A downside capture of 70 means the fund suffered only 70 per cent of the benchmark’s decline. Ideally, investors would want a fund with upside capture above 100 and downside capture below 100.Motilal Oswal Small Cap Fund illustrates this well. Its 117 per cent upside capture shows that it participated strongly during market rallies, while its 75 per cent downside capture indicates that it absorbed only about three-fourths of the benchmark’s decline during weak periods.The fund consequently delivered 15 per cent, well ahead of the benchmark’s 3.5 per cent.Union Small Cap, Sundaram Small Cap and WOC Multi Cap also showed a favourable balance between upside participation and downside protection.Investor takeaway: Active management does not have to win by taking bigger bets. Sometimes, losing significantly less during market declines can be a more effective route to sustained outperformance.Prudent stock selectionAn analysis of the top-performing diversified funds over the last two years suggests that stock selection played an important role, with no single sector or market-cap bias explaining the winners. Financials, industrials, healthcare, manufacturing and consumer-facing businesses featured prominently, while several funds benefited from meaningful exposure to mid- and small-cap stocks that delivered outsized gains.The portfolios of laggards, in contrast, reveal the cost of owning the wrong stocks, irrespective of sector positioning. Higher exposure to mature large-caps, consumer staples, chemicals, retail, agrochemicals and select IT stocks weighed on returns amid earnings moderation and valuation compression. High portfolio churn and extensive diversification were also visible among some of the laggards.Uninterrupted inflowsThe last two years were marked by elevated global interest rates, sticky inflation and geopolitical tensions, including the US-Israel-Iran conflict. Persistent foreign portfolio investor (FPI) outflows weighed on large-caps, while steady domestic institutional inflows cushioned the downside.Despite the volatility, actively-managed equity funds attracted ₹7.5 lakh crore in net inflows over the two-year period. Flexi-cap funds led with ₹1.5 lakh crore, followed by sectoral/thematic funds at ₹1.2 lakh crore and small-cap funds at ₹1.1 lakh crore. Their combined AUM rose to ₹38.4 lakh crore from ₹30.1 lakh crore during the period.Retail participation also remained resilient. Monthly SIP collections rose from ₹23,545 crore to ₹31,961 crore over the 24 months, highlighting the growing stickiness of systematic investing and the resilience of domestic investor flows despite market volatility.How the major categories faredLarge-capLarge-cap funds operated in a subdued return environment, with most schemes, barring the top three, delivering returns within a narrow range. Motilal Oswal Large Cap Fund topped the category with a 7.1 per cent CAGR against 1.8 per cent for the benchmark. Its edge came from adding turnaround bets such as Samvardhana Motherson International, Bajaj Finance and Titan, while cutting exposure to bruised IT stocks.JM Large Cap Fund was the laggard, delivering a -1.5 per cent CAGR. It retained meaningful exposure to laggards such as HDFC Bank, Reliance, Infosys, L&T and NTPC, as well as several mature large-cap franchises that generated modest or negative returns. The contrasting outcomes show that even in a low-alpha category, the edge in large-cap investing lies in conviction and the speed at which portfolios adapt to changing opportunities.Mid-capMid-cap funds saw a sharp divergence in performance, with returns ranging from 13.6 per cent to -3.6 per cent, against 6 per cent for the benchmark. Invesco India Midcap topped the category with 13.6 per cent, helped by early positions in L&T Finance and Max Healthcare.At the other end, Quant Mid Cap lagged, hurt by elevated exposure to stocks such as IRB and Tata Communications and its PSU bets. Its concentrated portfolio of just 23 stocks, against a category average of 69, combined with an aggressive 261 per cent portfolio turnover, proved counterproductive.Large & Mid CapThe category’s ability to invest across two market-cap segments offers flexibility, but flexibility alone does not create alpha. Invesco India Large & Mid Cap stood out partly because nearly one-fourth of its portfolio was tilted towards small-caps. Its outperformance was further supported by aggressive bets on healthcare, financials, aviation and digital consumption.At the other end, Tata Large & Mid Cap lagged, hurt by heavy positions in HDFC Bank, Reliance, PI Industries, Varun Beverages and Tata group stocks.Small-capThe defining skill in small-caps is not merely spotting potential multibaggers, but knowing when to cut exposure as the investment thesis weakens. The period offered little evidence that a larger portfolio necessarily delivered better outcomes. Nippon India Small Cap, with 251 stocks, and ICICI Prudential Smallcap, with 130, underperformed the benchmark’s 3.5 per cent CAGR, while the equally diversified Bandhan Small Cap, with 260 stocks, outpaced it.Motilal Oswal Small Cap led with a 15.3 per cent return, favouring a concentrated portfolio of 61 stocks and high-conviction bets across infrastructure, diagnostics and banking. At the other end, Tata Small Cap was the only fund to post a negative return, weighed down by exposure to lagging chemicals, retail and logistics stocks.Flexi-capFlexi-cap funds are often positioned as ‘go anywhere’ strategies, but their real edge lies not in the breadth of the stock universe, but in making and sustaining decisive market-cap allocation calls. The past two years rewarded funds that rotated across market-cap segments ahead of the cycle, rather than simply relying on stock selection.Aditya Birla Sun Life Flexicap topped the category. It cut large-cap exposure from 70 per cent to 55 per cent and shifted decisively towards BFSI/NBFCs and industrials as rates and credit conditions turned favourable, while reducing IT exposure. At the other end, Samco Flexicap lagged despite high portfolio churn, with turnover of about 190 per cent over two years.Multi-capMulti-cap mandates require funds to maintain meaningful exposure across all three market-cap segments. Motilal Oswal Multi Cap topped the category, striking a favourable balance between upside participation of 142 per cent and downside capture of 92 per cent. Its performance was aided by strong mid- and small-cap picks such as Shaily Engineering Plastics and Coforge.At the other end, Quant Multi Cap lagged as several high-conviction small-cap bets suffered steep declines, including Rossell India, Lancer Container and Aditya Birla Fashion.Published on August 15, 2026
Motilal Oswal Small Cap, Bank of India Small Cap, Parag Parikh Flexi Cap, Helios Flexi Cap: Flat Nifty, Divided Fortunes: The Two-Year Tale of Equity Fund Winners and Losers
Discover how a flat Nifty masked significant performance disparities among equity mutual funds, revealing crucial insights for investors.
1,886 words~9 min read