Essential productivity kit for .NET and game developers
.NET Tools
ReSharper Platform
As .NET developers, we need to iterate on our applications while building, and part of that developer inner loop is the debugging experience. The rise of multi-platform code editors further requires developers to have all the functionality they need to build and debug their application out of the box, wherever they’re coding. Previously, .NET developers could leverage the ReSharper extension for Visual Studio Code to build .NET applications, but they lacked a proper debugging experience. That changes now.
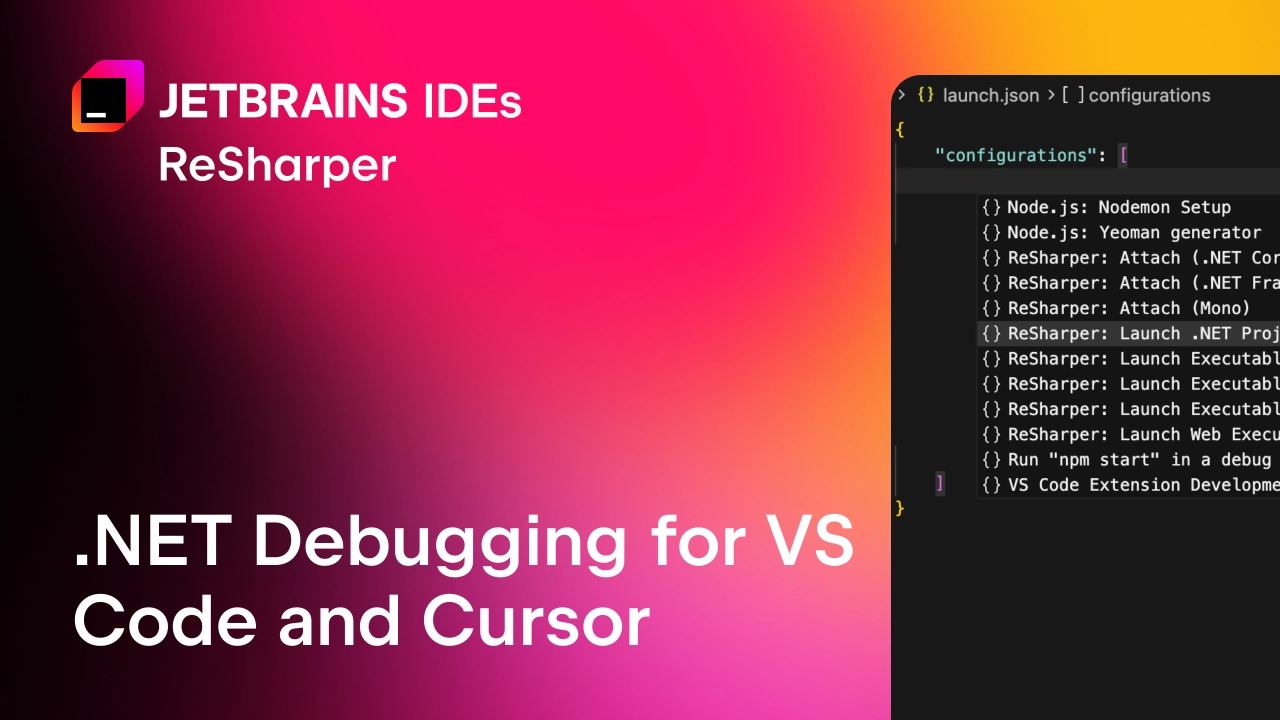
With the release of version 2026.2, our built-in .NET debugger is officially live, bringing the battle-tested debugging engine powering JetBrains Rider directly into VS Code and compatible environments. But as engineers, we know a fundamental truth: Debugging is a reactive process. While a robust debugger is essential for diagnosing a failing runtime state, relying on it as your primary tool for catching errors is incredibly inefficient. A highly productive workflow is proactive, leveraging static analysis and structural code intelligence tools to prevent bugs from being compiled in the first place. With the arrival of the debugger, we add to the already rich experience included in the extension. We now offer a completely unified, highly intelligent development ecosystem inside your lightweight editor. To learn more about the debugger and its capabilities, read the announcement blog post.