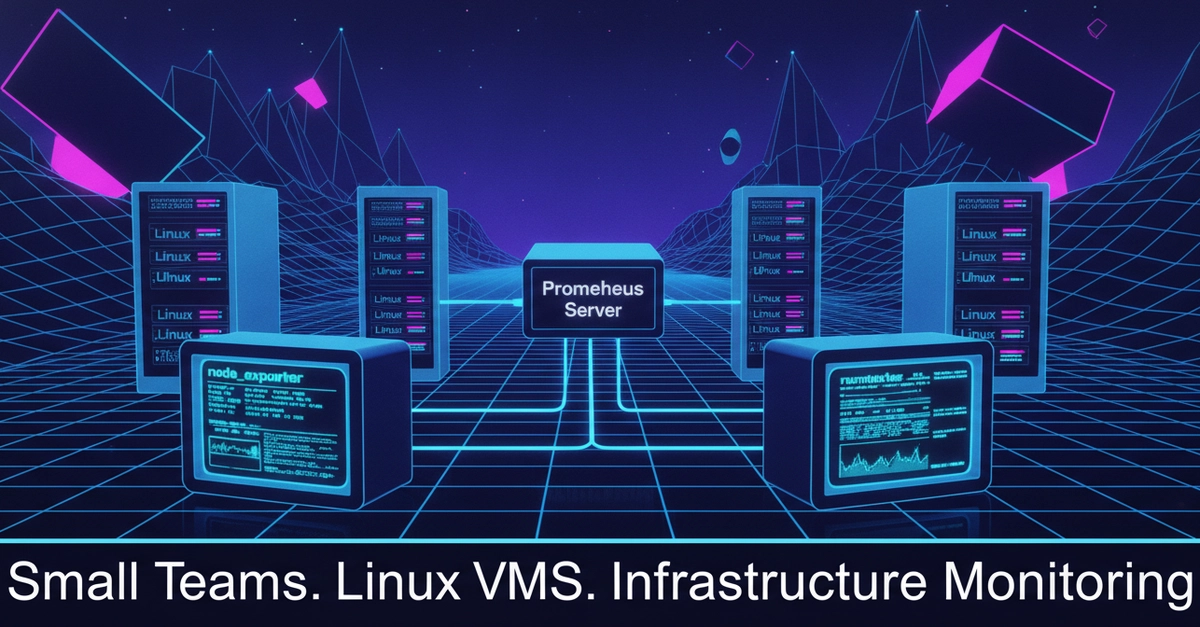
Once a Kubernetes cluster is up and running, monitoring what's happening inside it — CPU and memory usage, number of active replicas, application latency — stops being optional. Prometheus is today's de facto standard for monitoring in the Kubernetes ecosystem: a time-series database that periodically collects metrics (pull model) and lets you query and alert on them.
In this article, I show how to install Prometheus on an on-premise cluster using Helm, and how to prepare your own applications to be monitored by it.
Prerequisites
Before installing Prometheus, make sure you already have:
Helm installed (see the dedicated article if you don't have it yet);