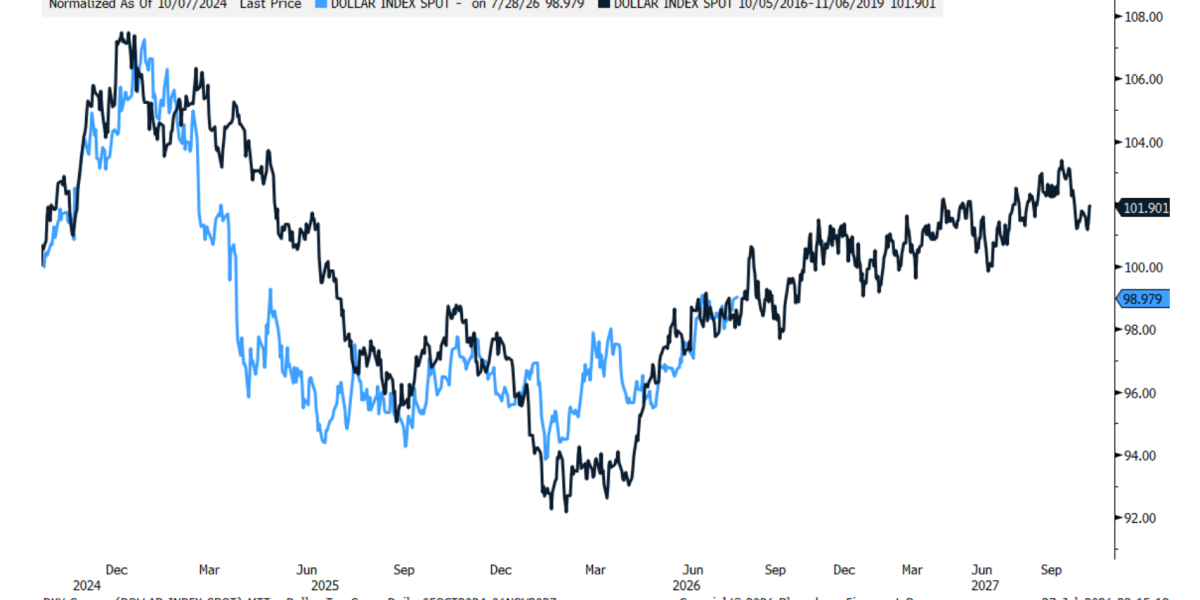
Back in January 2025, Adam Turnquist built a chart. LPL Financial’s chief technical strategist had overlaid the U.S. Dollar Index’s trajectory across Donald Trump’s two presidential terms — a simple comparison, he figured, to see how the second was shaping up against the first. He’s been updating it every couple of months since, sharing it with his head of macro research each time with the same running joke: why do we even try to predict?
“It’s the exact same pattern,” he told Fortune. “Last week, I started refreshing data, and here it is.”
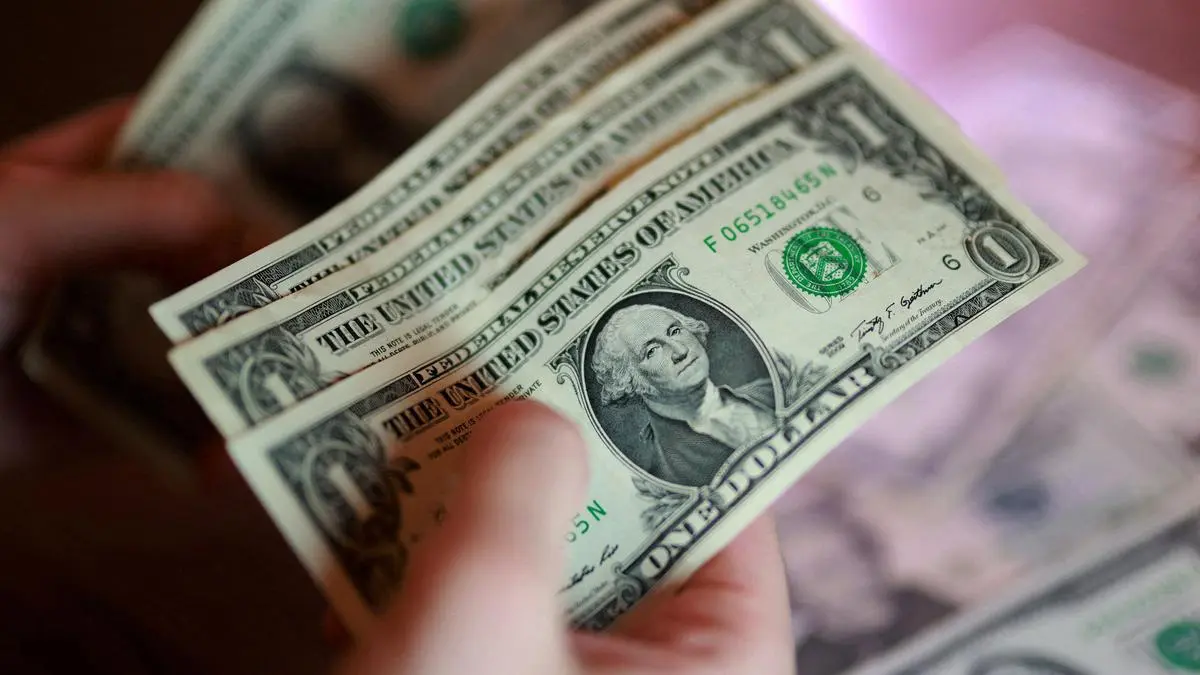
The pattern matters now because of where it says the dollar is. After a 13% decline over 269 trading days from its January 2025 peak, the Dollar Index has broken out above resistance near the 100 level — the same stage-three move that followed the Trump first-term bottom in early 2018. If that playbook holds, Turnquist thinks the dollar may be entering another sustained climb.
Two terms, one script
The symmetry in the chart is almost uncomfortable to look at. “The dollar has tracked so closely, not only in the magnitude but the duration of the moves,” he said. After Trump’s 2016 victory, the Dollar Index rallied roughly 8% into a January 2017 peak, then reversed hard — falling about 15% over 293 trading days before bottoming in early 2018. From there, it staged a 17% climb into a 2020 high, a run that ended only when the pandemic arrived.