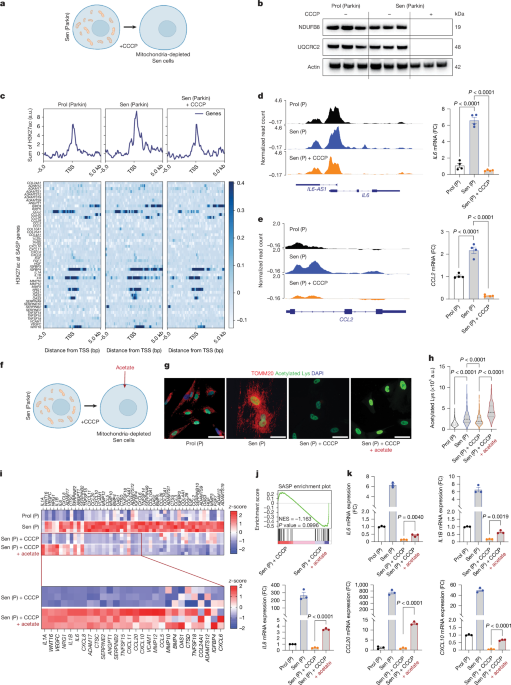
MainCellular senescence is a key response to various cellular stresses, characterized by a permanent cell cycle arrest and the secretion of a pro-inflammatory cocktail of factors known as SASP1. Senescence serves important roles in embryonic development4,5, tumour suppression6 and tissue repair7,8. However, persistent SASP activation can lead to chronic inflammation, contributing to tissue dysfunction, ageing and a broad spectrum of age-related diseases, including cancer1. This dual nature makes SASP a focal point for understanding both protective and detrimental effects of senescence.Mitochondria, which are central to cellular metabolism, undergo substantial changes during senescence9,10. These include impaired bioenergetic function, disrupted mitochondrial dynamics and metabolic reprogramming, particularly involving the tricarboxylic acid (TCA) cycle11. Increased levels of TCA cycle intermediates, such as acetyl-CoA, fumarate and succinate, accumulate in senescent cells11.Beyond metabolic remodelling, mitochondria in senescent cells generate innate immune signals. In senescence and ageing, mitochondrial dysfunction promotes cytosolic release of mitochondrial DNA (mtDNA), which activates cGAS–STING signalling and drives inflammatory responses and SASP3,12,13. How these inflammatory signals integrate with mitochondrial metabolic cues to regulate SASP gene expression remains unclear.Here we show that mitochondrial metabolism is a key determinant of SASP expression through regulation of histone acetylation at inflammatory gene loci. In senescent cells, pathways that control cytosolic acetyl-CoA production, including mitochondrial citrate export and its conversion by ATP-citrate lyase, are upregulated. This metabolic rewiring sustains chromatin accessibility at SASP regulatory elements. Disrupting this axis suppresses SASP expression despite persistent cytosolic mtDNA signalling. Together, these findings indicate that mitochondrial innate immune signalling requires metabolic–epigenetic regulation to drive SASP gene expression. Pharmacological inhibition of this pathway in aged mice selectively suppresses SASP-associated inflammation without reversing cellular senescence, reducing tissue inflammation and improving healthspan.Mitochondria promote acetylation at SASP lociAcetyl-CoA is the obligate donor for protein acetylation, including histone acetylation14,15, a modification associated with chromatin relaxation and increased accessibility to transcriptional machinery. Although acetyl-CoA can be generated through several metabolic pathways, mitochondrial metabolism represents a major hub of acetyl group production. However, the extent to which mitochondrial metabolism contributes to histone acetylation during cellular senescence is not known.To address this, we utilized a previously established model of mitochondrial clearance in which human fibroblasts overexpressing Parkin are treated with CCCP to induce mitophagy and generate cells depleted of mitochondria16,17 (Fig. 1a). Mitochondrial depletion did not affect senescent cell viability (Extended Data Fig. 1a,b), but abolished respiration and mitochondrial protein content (Fig. 1b and Extended Data Fig. 1c). Fig. 1: Mitochondria modulate histone acetylation at SASP loci.a, Schematic representation of the experimental setup. Sen, senescent cells. Created in BioRender; Martini, H. https://biorender.com/of88ogz (2026). b, Western blot showing mitochondrial proteins UQCRC2 and NDUFB8, confirming loss of mitochondria in IMR90 Parkin-expressing senescent cells following CCCP treatment (Sen + CCCP) (n = 3). Prol, proliferative cells. c, Metaplot (top) and heat map (bottom) of H3K27ac enrichment at SASP genes, demonstrating reduced histone acetylation in mitochondria-depleted senescent cells. Signals were normalized to total histone H3 across ±5 kb from transcription start sites (TSS). Average of n = 3. a.u., arbitrary units. d,e, Browser track (left) and mRNA expression (right) of IL6 (d) and CCL2 (e) genes, displaying H3K27ac distribution. qPCR data, n = 4. Parkin and (P) indicate Parkin-overexpressing cells. FC, fold change. f, Scheme of the experimental workflow. Created in BioRender; Martini, H. https://biorender.com/of88ogz (2026). g, Representative immunofluorescence images of nuclear acetylated lysine and mitochondria staining (TOMM20). Scale bars, 50 μm. h, Quantification of nuclear acetylated lysine per cell from n = 3 independent experiments. i, Top, heat map of SASP genes in proliferative cells, senescent cells, senescent cells in the absence of mitochondria and after acetate treatment. Bottom, heat map of SASP genes that show increased expression in cells without mitochondria after acetate treatment. The colour intensity represents column z-score. n = 3. j, Gene set enrichment analysis (GSEA) enrichment plot of the 51 SASP genes, comparing senescent cells lacking mitochondria without and after acetate treatment. NES, normalized enrichment score. k, mRNA expression levels of various SASP genes (n = 3). Data are mean ± s.e.m. One-way ANOVA with Tukey’s multiple comparison test (d,e,h); weighted Kolmogorov–Smirnov-like test (j); or two-sided Student’s t-test (k). Senescence was induced by X-ray irradiation (IR). n represents the number of independent experiments. NS, not significant (P > 0.05).Source dataChromatin immunoprecipitation with sequencing (ChIP–seq) analysis of histone H3 acetylation at lysine 27 (H3K27ac) revealed that loci that gained acetylation during senescence were markedly reduced following mitochondrial clearance (Extended Data Fig. 1d). Pathway analysis showed that these regions were enriched for inflammatory and interleukin signalling pathways, central components of SASP (Extended Data Fig. 1e). Consistent with this, we identified a 51-gene SASP signature that was induced during senescence but suppressed upon mitochondrial removal (Extended Data Fig. 2a). H3K27ac enrichment at these loci was concordantly reduced following mitochondrial clearance (Fig. 1c), with representative genes such as IL6 and CCL2 showing coordinated decreases in chromatin acetylation and mRNA expression (Fig. 1d,e). These findings indicate that mitochondria are required to sustain histone acetylation at SASP genes.Having established that H3K27ac at SASP loci is increased during senescence and reduced by mitochondrial clearance, we next explored whether this regulation extends across histone marks and senescence contexts. Analysis of multiple published ChIP–seq datasets spanning multiple acetylated histone marks and senescence models, including irradiation, etoposide, oncogene-induced and replicative senescence, revealed consistent enrichment of histone acetylation at SASP gene loci (Extended Data Fig. 2b–j).Given that mitochondrial clearance suppresses histone acetylation at SASP genes, we next tested whether this effect reflects reduced availability of acetyl-CoA. Because acetyl-CoA is not membrane permeable, we supplemented cells with acetate (Extended Data Fig. 3a), which is converted intracellularly into acetyl-CoA by ACSS2 (ref. 18). Acetate isotope tracing experiments confirmed rapid incorporation of exogenous acetate into acetyl-CoA (Extended Data Fig. 3b). Moreover, acetate supplementation increased global nuclear acetylation, including H3K27ac (Extended Data Fig. 3c–e), and induced expression of pro-inflammatory genes, including IL6, IL8, IL1B and CCL2, without affecting cell cycle regulators p16 (also known as CDKN2A) and p21 (also known as CDKN1A) (Extended Data Fig. 3f,g).To test whether acetyl-CoA is sufficient to restore SASP expression in the absence of mitochondria, we supplemented mitochondria-depleted senescent cells with acetate (Fig. 1f). Acetate supplementation increased histone acetylation (Fig. 1g,h) and partially restored a subset of the mitochondrial-dependent SASP programme, as determined by RNA sequencing (RNA-seq) and quantitative PCR (qPCR) (Fig. 1i–k).Together, these findings demonstrate that mitochondria regulate SASP gene expression through acetyl-CoA-dependent histone acetylation, establishing acetyl-CoA as a key metabolic link between mitochondria and epigenetic regulation of inflammatory genes.Mitochondrial citrate–acetyl–CoA axis drives SASPHaving established that acetyl-CoA is sufficient to promote histone acetylation and SASP gene expression, and that mitochondria are required for this process, we next investigated how mitochondrial metabolic pathways contribute to this regulation.We first examined the mitochondrial pyruvate carrier (MPC), which links glycolysis-derived pyruvate to the TCA cycle (Extended Data Fig. 4a). Expression of MPC1 and MPC2 were increased across multiple senescence models, including irradiation-induced, doxorubicin-induced and replicative senescence (Extended Data Fig. 4b,c). Pharmacological inhibition of MPC with UK5099 reduced TCA cycle intermediates, which are upregulated in senescence, and increased lactate levels, consistent with impaired mitochondrial pyruvate import (Extended Data Fig. 4d). RNA-seq and cytokine profiling revealed that MPC inhibition suppressed SASP gene expression and secretion (Extended Data Fig. 4e,f), without affecting cell cycle arrest, as assessed by proliferation-associated gene expression, p16 and p21 levels, EdU incorporation and DNA damage foci (Extended Data Figs. 4g,h and 5a–d,f). Similar effects were observed across distinct senescence models (Extended Data Fig. 5e,g–j). Consistent with these findings, CRISPR–Cas9-mediated deletion of MPC1 reduced expression of SASP factors such as IL6 and IL8 (Extended Data Fig. 5k,l).We next focused on the mitochondrial citrate carrier SLC25A1, which exports citrate to the cytosol, where it can be converted to acetyl-CoA19 (Fig. 2a). SLC25A1 expression was significantly increased at both mRNA and protein levels in multiple senescence contexts (Fig. 2b,c). Genetic ablation of SLC25A1 did not alter expression of CDK inhibitors or cell cycle arrest (Fig. 2d–g), but led to a marked reduction in SASP gene expression (Fig. 2h–l). Similarly, pharmacological inhibition of SLC25A1 using CTPI2, a third-generation inhibitor with high binding affinity and specificity20 (Fig. 3a), resulted in a dose-dependent suppression of SASP components at both the transcript and protein levels (Fig. 3b–e and Extended Data Fig. 6a). This effect occurred without alterations in cell cycle regulators, HMGB1 localization, DNA damage foci or proliferation markers (Fig. 3f–h and Extended Data Fig. 6b–e). RNA-seq and pathway analysis confirmed that CTPI2 downregulated inflammatory and mitochondrial-dependent SASP programmes, but had no effect on cell cycle-associated gene expression (Fig. 3i–k). These effects were consistent across senescence models and treatment windows, including treatment initiated shortly after senescence induction as well as in fully established senescent cells (Extended Data Fig. 7a–c).Fig. 2: Upregulation of SLC25A1 modulates SASP in senescent cells.a, Schematic illustration of SLC25A1 localization and function in mitochondria. Created in BioRender; Passos, J. https://biorender.com/zq5sona (2026). b, Western blot showing increased SLC25A1 protein in senescence models. Sen (Dox) indicates doxorubicin-induced senescence; Sen (RS) indicates replicative senescence. c, mRNA expression of SLC25A1 in these senescence models compared to in proliferative cells. Prol, n = 15; Sen (IR), n = 6; Sen (Dox), n = 6; Sen (RS), n = 3. d, Western blot confirming successful CRISPR–Cas9-mediated deletion of SLC25A1 (Δ SLC25A1) in proliferative (Prol) and senescent (Sen (IR)) cells, with persistent p16 expression in senescent cells after knockout. EV, empty vector. e–g, Expression of mRNA encoding the CDK inhibitors p21 (e), p16 (f) and p15 (g) in irradiation-induced senescent cells with or without SLC25A1. n = 9. h–l, Expression of mRNA encoding the SASP components IL6 (h), IL8 (i), IL1B (j), CCL2 (k) and CX3CL1 (l) under the same conditions. Data are presented as fold change relative to proliferative cells (Prol). n = 6 (h); n = 9 (i–k); n = 6 (l). Data are mean ± s.e.m. One-way ANOVA with Tukey’s multiple comparison test.Source dataFig. 3: Pharmacological inhibition of SLC25A1 reduces SASP in senescent cells.a, Schematic illustrating the experimental approach. Created in BioRender; Passos, J. https://biorender.com/zq5sona (2026). b–g, Expression of mRNA encoding the SASP components IL6 (b), IL8 (c), IL1B (d) and CCL2 (e) and the CDK inhibitors p16 (f) and p21 (g) in irradiation-induced senescent cells treated with 15 μM or 30 μM CTPI2, expressed as fold change relative to proliferative cells. b–e,g, Prol, n = 15; Sen (IR), n = 15; Sen (IR) 15 μM, n = 12; Sen (IR) 30 μM, n = 12. f, Prol, n = 9; Sen (IR), n = 9; Sen (IR) 15 μM, n = 9; Sen (IR) 30 μM, n = 6. h, Western blot analysis showing that CTPI2 treatment does not alter expression of p16 or p21, and does not restore cyclin A levels. i, Reactome pathways of genes downregulated by CTPI2 compared to in untreated senescent cells. GO, Gene Ontology. j,k, Column-clustered heat maps showing SASP factor genes (j) and cell cycle-associated genes (k). Colour intensity represents column z-scores; n = 3. l, Representative immunofluorescence images of nuclear acetylated lysine in two models of senescence treated with or without CTPI2. Veh, vehicle. Scale bars, 50 μm. m, Quantification of integrated nuclear acetylated lysine density per cell. n = 3. n, Western blots showing reduced H3K27ac after CTPI2 treatment with irradiation-induced (top) or replicative (bottom) senescence. o, Metaplot (top) and heat map (bottom) of SASP genes showing reduced histone H3K27ac levels normalized to histone H3 around the transcription start sites (±5 kb) in irradiation-induced senescent after CTPI2 treatment (data averaged from n = 3). p, Browser tracks of IL6 (top) and CCL2 (bottom) genes, depicting reduced H3K27ac levels following CTPI2 treatment. Data are mean ± s.e.m. One-way ANOVA with Tukey’s multiple comparison test (b–g); hypergeometric test with Benjamini–Hochberg false discovery rate correction (i); two-tailed Mann–Whitney test (m). n represents the number of independent experiments.Source dataMechanistically, SLC25A1 inhibition reduced global nuclear acetylation, including pan-acetylated lysine staining and H3K27ac levels (Fig. 3l–n), and decreased H3K27ac at SASP loci as determined by ChIP–seq (Fig. 3o,p). Additional histone marks, including H3K9ac, were similarly reduced. Metabolic tracing demonstrated that incorporation of glucose-derived carbon into histone acetylation was abolished upon SLC25A1 inhibition (Extended Data Fig. 6f–h). Notably, CTPI2 did not broadly impair mitochondrial function, as oxidative phosphorylation (OXPHOS) gene expression, ATP production, coupling efficiency, mitochondrial reactive oxygen species levels and mitochondrial morphology were largely unchanged (Extended Data Fig. 8a–i). Metabolomic analysis revealed that inhibition of SLC25A1 reduced citrate, isocitrate and cis-aconitate in whole-cell extracts (Extended Data Fig. 8j). As SLC25A1 mediates citrate export to the cytosol, we performed subcellular fractionation and found that acetyl-CoA levels were selectively reduced in the cytosolic fraction (Extended Data Fig. 8k,l), indicating impaired generation of nucleocytosolic acetyl-CoA required for histone acetylation.Finally, we assessed the downstream conversion of mitochondria-derived citrate into acetyl-CoA via ATP-citrate lyase (ACLY) (Fig. 4a). Because citrate exported from mitochondria serves as the principal substrate for cytosolic acetyl-CoA production, we tested whether increasing citrate availability is sufficient to drive histone acetylation and inflammatory gene expression. Citrate supplementation increased histone acetylation and induced pro-inflammatory gene expression in proliferating cells (Fig. 4b,c). ACLY expression was increased across multiple senescence models (Fig. 4d), and its silencing reduced both H3K27ac levels and SASP gene expression in irradiation-induced and replicative senescence (Fig. 4e–h).Fig. 4: Mitochondria-derived citrate drives SASP through ACLY activity.a, Schematic representation illustrating the export of citrate from mitochondria and conversion to acetyl-CoA. Created in BioRender; Passos, J. https://biorender.com/zq5sona (2026). b, Relative mRNA expression of SASP components in proliferative cells treated with 10 mM citrate compared to in untreated proliferative cells (control), shown as fold change. n = 9. c, Western blot analysis of H3K27ac and total histone H3, demonstrating increased histone acetylation in citrate-treated cells. d, Relative mRNA expression of ACLY in cells undergoing senescence induced by various stimuli. Prol, n = 9; Sen (IR), n = 6; Sen (RS), n = 3; Sen (Dox), n = 6. e, mRNA expression in irradiation-induced senescence, showing successful ACLY knockdown by small interfering RNA (siRNA) and subsequent effects on genetic expression of SASP components, expressed as fold change relative to proliferative cells. n = 3. f, Western blot analysis showing reduced H3K27ac following ACLY silencing in irradiation-induced senescent cells. g, mRNA expression in replicative senescence, showing effective ACLY knockdown by siRNA and effects on SASP gene expression, presented as fold change relative to proliferative cells. n = 3. h, Western blot analysis indicating decreased H3K27ac in cells displaying replicative senescence, following ACLY silencing. Data are mean ± s.e.m. Two-sided Mann–Whitney test (b,d); two-sided Student’s t-test (d (Dox)); one-way ANOVA with Tukey’s multiple comparison test (e,g). n represents the number of independent experiments.Source dataTogether, these findings identify the mitochondrial citrate–acetyl-CoA axis as a central regulator of SASP gene expression. Multiple nodes within this pathway, from pyruvate import to citrate export and acetyl-CoA generation, converge to control histone acetylation at SASP loci, thereby selectively modulating inflammatory gene expression without affecting the senescence-associated cell cycle arrest.mtDNA and metabolism co-regulate SASPHaving established that mitochondrial metabolism regulates SASP gene expression through acetyl-CoA-dependent histone acetylation, we next explored whether this pathway intersects with mtDNA-driven innate immune signalling, a known regulator of SASP. Cytosolic DNA species activate cGAS–STING signalling in senescent cells21, and mtDNA leakage has emerged as a key mitochondrial input driving inflammatory programmes during senescence and ageing3,12,13. We therefore examined whether mitochondrial regulation of histone acetylation and mtDNA–cGAS–STING signalling are mechanistically linked or represent distinct inputs into SASP control.To determine whether suppression of SASP through inhibition of mitochondrial-dependent histone acetylation involves altered mtDNA signalling, we quantified cytosolic mtDNA following SLC25A1 inhibition (Fig. 5a). Cytosolic mtDNA levels were unchanged in senescent MRC5 and IMR90 fibroblasts following SLC25A1 inhibition (Fig. 5b–d and Extended Data Fig. 9a–d), indicating that metabolic regulation of histone acetylation restrains SASP independently of mtDNA release.Fig. 5: Mitochondrial citrate metabolism and mtDNA–cGAS–STING signalling independently regulate SASP.a, Schematic of mitochondrial citrate export influencing histone acetylation. Created in BioRender; Passos, J. https://biorender.com/uvwu372 (2026). b, Representative immunofluorescence images of mitochondrial network (TOMM20) and DNA staining in MRC5 cells. Arrows indicate DNA foci outside mitochondria. Scale bars, 20 μm. c, Quantification of DNA foci outside the mitochondrial network per cell. n = 3. d, Cytosolic mtDNA levels expressed as fold change compared with proliferative cells. n = 3. e, Schematic illustrating mtDNA leakage and activation of the cGAS–STING pathway driving SASP expression. Created in BioRender; Passos, J. https://biorender.com/uvwu372 (2026). f, Immunofluorescence of the mitochondrial network (TOMM20) and DNA staining with empty vector or BAX and BAK1 knockout (ΔBAX/BAK1). Arrows indicate DNA foci outside the mitochondria. Scale bars, 10μm. g, Quantification of DNA foci outside the mitochondrial network per cell. n = 3. h, Western blot showing the efficiency of BAX and BAK knockout in irradiation-induced senescent cells. i, mRNA expression of SASP genes in proliferative or irradiation-induced senescent ΔBAX/BAK1 cells and controls. Data are expressed as fold change relative to proliferative cells. n = 3. j, Immunofluorescence of nuclear acetylated lysine. Scale bars, 30 μm. k, Quantification of nuclear acetylated lysine integrated density per cell. n = 3. l, Western blot showing no change in H3K27ac in irradiation-induced ΔBAX/BAK1 cells compared with controls. m, Schematic representation of the experimental setup. Created in BioRender; Martini, H. https://biorender.com/of88ogz (2026). n, Western blot showing H3K27ac and the absence of mitochondria (UQCRC2) in mitochondria-depleted conditions. o, mRNA expression of SASP genes under the indicated conditions. Data are expressed as fold change relative to proliferative cells. n = 3. One-way ANOVA with Tukey’s multiple comparison test performed on groups with Sen (IR) + CCCP. p, Heat map of SASP factors in irradiation-induced senescent cells lacking mitochondria that were supplemented with acetate alone or acetate plus mtDNA. z-score representation. n = 3. q, GSEA enrichment plot of SASP factors. NES, normalized enrichment score. Data are mean ± s.e.m. Statistical tests: One-way ANOVA with Tukey’s multiple comparison test (c,g,k,o), uncorrected Fisher’s LSD (i), or two-tailed Student’s t-test (d). n represents the number of independent experiments.Source dataWe next tested the reciprocal relationship. Senescent BAX- and BAK1-deficient fibroblasts, which exhibit impaired cytosolic mtDNA release, showed reduced SASP gene expression (Fig. 5e–i and Extended Data Fig. 9f), as previously reported11. However, global nuclear acetylation and H3K27ac levels, as well as H3K27ac enrichment at SASP loci, were unchanged (Fig. 5j–l and Extended Data Fig. 9e). Similarly, pharmacological inhibition of cGAS–STING signalling using the STING inhibitor SN011 suppressed SASP gene expression without affecting histone acetylation (Extended Data Fig. 9g–i). Together, these findings indicate that mtDNA–cGAS–STING signalling and mitochondrial control of histone acetylation operate as independently regulated pathways.Despite this independence, we next explored whether these pathways functionally cooperate to drive SASP expression. Acetate supplementation increased H3K27ac levels in senescent cells independently of STING inhibition (Extended Data Fig. 9j), but acetate-induced SASP gene expression was suppressed by SN011 (Extended Data Fig. 9k), indicating that chromatin accessibility alone is not sufficient to drive SASP transcription in the absence of innate immune activation.We therefore tested whether combined activation of these pathways is sufficient to reconstitute SASP expression. Senescent cells lacking mitochondria were treated with acetate, mtDNA, or both (Fig. 5m). mtDNA transfection did not alter H3K27ac levels, whereas acetate increased histone acetylation, with no additional effect of mtDNA co-treatment (Fig. 5n), confirming that mtDNA signalling does not directly regulate histone acetylation. Transcriptomic and pathway analyses revealed enrichment of inflammatory and cytokine signalling programmes following either treatment alone, with markedly greater enrichment when both were combined (Extended Data Fig. 9l,m). Consistently, qPCR and RNA-seq analyses showed that acetate or mtDNA alone partially induced SASP gene expression, whereas their combination resulted in a stronger activation of the SASP programme (Fig. 5o–q).Together, these findings demonstrate that mitochondrial metabolic control of histone acetylation and mtDNA–cGAS–STING signalling represent distinct but complementary pathways that converge to enable full SASP gene expression.SLC25A1 inhibition improves healthspanGiven that mitochondrial metabolism regulates SASP gene expression through acetyl-CoA-dependent chromatin remodelling, we next tested whether this pathway can be targeted in vivo to suppress inflammation and improve tissue function during ageing. As an initial step, we assessed the effects of SLC25A1 inhibition ex vivo using stromal cells isolated from young and aged mouse tissues. Aged stromal cells from heart and kidney exhibited increased expression of p16 and genes encoding SASP factors compared with young controls, which were selectively reduced by treatment with the SLC25A1 inhibitor CTPI2 without altering p16 expression (Supplementary Fig. 1a–f). These findings suggested that targeting mitochondrial citrate metabolism can attenuate SASP in aged cells, prompting us to test this approach in vivo.We therefore administered CTPI2 to aged mice and assessed its effect on tissue function and systemic inflammation (Fig. 6a). CTPI2-treated mice (both male and female) exhibited a more lustrous and uniform fur coat, reduced alopecia and less fur greying (Fig. 6b), accompanied by delayed onset of frailty as measured by a 31-parameter frailty index22 (Fig. 6c,d).Fig. 6: Pharmacological inhibition of SLC25A1 during ageing improves frailty and muscle function.a, Schematic representation of the in vivo experimental procedure. Created in BioRender; Passos, J. https://biorender.com/zjxy02g (2026). b, Representative images of male and female mice treated with either vehicle or CTPI2. c, Frailty index scores at baseline (0 months) and after 3 months of treatment (end-point) in vehicle-treated (male, n = 18; female, n = 19) and CTPI2-treated (male, n = 19; female, n = 20) mice. d, Histogram of frailty index scores after 3 months of treatment. Vehicle: male, n = 18; female, n = 19. CTPI2: male, n = 19; female, n = 20. e, Cumulative percentage of mice that passed the 60-s tightrope test. n = 18 vehicle and n = 20 CTPI2-treated mice; male and females were combined. f, Cumulative percentage of mice that passed the 90-s hanging test. n = 19 vehicle, n = 20 CTPI2-treated mice; male and female mice were combined. g, Forelimb grip strength was measured at baseline, 1.5 months and 3 months (end-point). Vehicle: male, n = 10; female, n = 9. CTPI2: male, n = 9; female, n = 10. h, Wheat germ agglutinin (WGA) staining, marking the membrane of cross-sectional myofibres. Scale bars, 50 μm. i, Quantification of mean cross-sectional myofibre area per mouse. Vehicle: male, n = 9; female, n = 9. CTPI2: male, n = 9; female, n = 8. j, Distribution of cross-sectional myofibre area per mouse. Number of mice as in i. k,l, Percentage of centrally nucleated fibres per mouse in female (k; n = 9 per condition) and male (l; n = 9 per condition) mice. m,n, mRNA expression of SASP genes (m) and cell cycle inhibitors (n) in quadriceps muscle, expressed as fold change relative to vehicle. Vehicle: male, n = 10; female, n = 9. CTPI2: male, n = 9; female, n = 8. o, Correlation curves of Il1b or Il6 expression with forelimb grip strength for each mouse. Vehicle: male, n = 10; female, n = 9. CTPI2: male, n = 9; female, n = 8). Data are mean ± s.e.m. Two-tailed Student’s t-test. Males are represented by filled dots and females are represented by open dots. n represents the number of mice.Source dataFunctional assessment revealed enhanced neuromuscular performance, including improved coordination and balance (tightrope test), increased strength (hanging and grip strength tests) and preservation of muscle integrity, as indicated by increased myofibre cross-sectional area and reduced centrally nucleated fibres (Fig. 6e–l). Despite these improvements in musculoskeletal phenotypes, CTPI2 treatment did not improve spine and femur bone microarchitecture (Supplementary Table 1).Consistent with suppression of inflammatory signalling, CTPI2 treatment reduced SASP gene expression in skeletal muscle without altering expression of p16 or p21 (Fig. 6m,n). Expression of pro-inflammatory cytokines Il6 and Il1b negatively correlated with muscle strength (Fig. 6o), suggesting that reduced inflammation contributes to improved tissue function. Circulating inflammatory cytokines were also reduced (Extended Data Fig. 10a), indicating a systemic attenuation of inflammatory burden.To determine whether these effects extend to other organs, we performed RNA-seq of liver tissue. CTPI2 reduced expression of SASP-associated genes and decreased enrichment of the SenMayo senescence signature (Extended Data Fig. 10b–e), with more pronounced effects in male mice, whereas expression of p16 and p21 remained unchanged (Extended Data Fig. 10f).In the heart, p16 and p21 expression was similarly unchanged (Extended Data Fig. 10h). However, CTPI2 specifically reduced cardiomyocyte-associated secretory factors (Gdf15 and Edn3)23 in the whole heart, consistent with reduced cardiomyocyte hypertrophy. This occurred alongside with suppression of classical SASP factors in cardiac stromal cells (Extended Data Fig. 10g–l). These changes were further associated with reduced expression of pro-inflammatory CCR2+ macrophages markers in female mice (Extended Data Fig. 10m,n), consistent with decreased SASP-driven immune recruitment previously described in cardiac ageing24.Together, these findings demonstrate that targeting mitochondrial citrate metabolism suppresses inflammation across tissues and improves tissue function and healthspan during ageing, without detectable changes in p16 or p21 expression, consistent with SASP modulation rather than senescent cell clearance.SLC25A1 inhibition remodels SASP chromatinGiven that SLC25A1 inhibition attenuates SASP through reduced cytosolic acetyl-CoA and histone acetylation in vitro, we next tested whether similar epigenetic mechanisms operate in vivo. Because SLC25A1 inhibition improves muscle function in aged mice, we focused on quadriceps muscle as a physiologically relevant tissue. To address this, we performed single-nucleus multiome profiling of quadriceps muscle from aged mice treated with the SLC25A1 inhibitor CTPI2, enabling simultaneous assessment of transcriptional output and chromatin accessibility within the same nucleus (Fig. 7a).Fig. 7: Pharmacological inhibition of SLC25A1 suppresses SASP programmes and chromatin accessibility in senescent cells in vivo.a, Schematic of the multiome experiment workflow. Created in BioRender; Martini, H. https://biorender.com/34h0t62 (2026). b, Weighted nearest neighbour (WNN) uniform manifold approximation and projection (UMAP) showing cell-type clusters. FAPs, fibro-adipogenic progenitors; MTJ, myotendinous junction; MuSCs: muscle stem cells; NMJ: neuromuscular junction. c, WNN UMAP illustrating the number and distribution of cells from vehicle-treated and CTPI2-treated samples. d,e, WNN UMAP showing the distribution of senescent-like cells across clusters in vehicle-treated (d) and CTPI2-treated (e) samples. f, Violin plot of per-nucleus SASP score based on RNA expression. g, Dot plot showing mean SASP gene expression and the proportion of cells expressing each SASP factor across the four conditions. h, Violin plot of per-nucleus gene activity scores for SASP factors derived from assay for transposase-accessible chromatin with sequencing (ATAC–seq). i, Volcano plot comparing gene activity scores of individual SASP genes in senescent-like cells from vehicle-treated versus CTPI2-treated samples. j,k, Coverage plots for the representative SASP genes Ccl2 (j) and Igfbp4 (k). l, Schematic of the experimental workflow for histological analyses. Created in BioRender; Martini, H. https://biorender.com/34h0t62 (2026). m, Percentage of cells classified as p16+ and/or p21+ and PCNA− (non-proliferative) per sample. n, Nuclear acetylated lysine intensity in p16+p21+PCNA− (senescent) and normal (proliferative) cells in vehicle-treated and CTPI2-treated groups. o,p, Representative spatial plots of liver sections from vehicle-treated (o) and CTPI2-treated (p) mice, showing the distribution of p16+p21+PCNA− cells and their nuclear acetylated lysine intensity. q, Representative immunofluorescence images of p21 and p16 and acetyl lysine staining in vehicle-treated and CTPI2-treated livers from n = 4 mice per condition (one time staining). Scale bars, 35 μm. Data in f,h,n are shown as mean values (red dots); data in m are mean ± s.e.m. Two-tailed Wilcoxon test (f,h); two-tailed Wilcoxon rank sum test (i); one-way ANOVA with Bonferroni’s multiple comparison test (n); or two-tailed Student’s t-test (m).Source dataCell-type annotation revealed a predominance of type IIA and IIB myofibres, with comparable cellular composition between vehicle- and CTPI2-treated groups (Fig. 7b,c and Extended Data Fig. 11a–c). Immune cell abundance was reduced in CTPI2-treated muscles, consistent with diminished inflammatory burden (Extended Data Fig. 11c). Senescent-like nuclei, defined using a validated CoreScence gene signature25, were present at similar abundance and distribution across conditions (Fig. 7d,e and Extended Data Fig. 11d,e,g), consistent with unchanged expression of p16 and p21 (Fig. 6n).Despite unchanged senescent cell abundance, CTPI2 treatment significantly reduced SASP-associated transcription within senescent-like nuclei (Fig. 7f,g). This transcriptional suppression was accompanied by decreased chromatin accessibility at SASP loci, which were selectively enriched in senescent-like cells and attenuated by CTPI2 treatment (Fig. 7h,i and Extended Data Fig. 11f,h). Representative loci, including Ccl2 and Igfbp4, showed increased accessibility in senescent cells that was reduced upon treatment (Fig. 7j,k). Similar results were obtained using an independent senescence gene set26 (Extended Data Fig. 11i–m).To further assess histone acetylation in vivo, we analysed the liver, an organ in which CTPI2 treatment markedly reduced inflammation. Iterative indirect immunofluorescence imaging (4i) was performed using antibodies against p21, p16, PCNA and pan-lysine acetylation (Fig. 7l). Given concerns regarding p16 antibody specificity, the signal was validated using p16-knockout mice treated with the senescence-inducing agent doxorubicin (Supplementary Fig. 2). Across treatment conditions, the abundance of p16+ and/or p21+PCNA− cells remained unchanged (Fig. 7m), consistent with transcriptional data. By contrast, these cells exhibited increased nuclear histone acetylation compared to non-senescent cells, which was reduced following CTPI2 treatment (Fig. 7n–q).To determine whether these effects are accompanied by broader metabolic alterations, we performed comprehensive metabolic profiling. CTPI2-treated aged mice displayed glucose tolerance comparable to controls, with modest reductions in fasting and fed glucose levels (Extended Data Fig. 12a–c). Other circulating biochemical parameters, including total protein, calcium and albumin, were largely unchanged and remained within physiological ranges (Extended Data Fig. 12d). Body weight, body composition, metabolic rate, respiratory exchange ratio and activity were also unaffected (Extended Data Fig. 12e–l). Lipid and fatty acid metabolic pathways in liver, muscle and heart were similarly unchanged, consistent with in vitro observations showing no effect of CTPI2 on lipid metabolic gene expression in senescent fibroblasts (Extended Data Fig. 12m–u).Finally, to assess the relevance of our findings in humans, we analysed transcriptomic datasets from multiple human tissues. Across muscle, heart, hippocampus and kidney, expression of the mitochondrial citrate transporter gene SLC25A1 positively correlated with a mitochondrial-dependent SASP gene signature and with canonical senescence markers p16 and p21, whereas chronological age alone showed little or no association (Extended Data Fig. 13a–p). These observations suggest that mitochondrial citrate metabolism is linked to senescence-associated inflammatory programmes across diverse human tissues.Together, these data indicate that CTPI2 treatment in aged mice suppresses SASP-associated transcription through selective epigenetic remodelling at inflammatory loci, without broadly altering systemic metabolism or senescent cell abundance. This epigenetic suppression of SASP provides a mechanistic basis for the observed improvements in tissue function and healthspan during ageing.DiscussionIn this study, we identify mitochondrial metabolism as a regulator of histone acetylation and inflammatory gene expression during senescence. Using genetic and pharmacological perturbations across multiple nodes of the mitochondrial citrate–acetyl-CoA axis, including MPC, SLC25A1 and ACLY, we show that mitochondrial metabolism is required to sustain histone acetylation at SASP loci and maintain inflammatory gene expression. These findings position mitochondrial metabolism as an upstream determinant of chromatin accessibility in senescent cells. This aligns with previous reports linking citrate metabolism to SASP regulation27.Although acetyl-CoA can be generated from alternative sources, including acetate, fatty acid oxidation and amino acid metabolism, our data indicate that in senescent cells, mitochondria constitute a dominant source of acetyl-CoA for chromatin modification. This suggests that the metabolic wiring of senescent cells creates a dependence on mitochondrial acetyl-CoA to sustain epigenetic activation of inflammatory gene programmes.An important feature of our findings is the modulation of SASP, rather than the cell cycle arrest component of senescence. One explanation for this specificity lies in the chromatin architecture of SASP genes. Previous work has shown that many SASP-associated genes are linked to super-enhancer-like regions that are particularly sensitive to changes in histone acetylation28. Such loci probably require sustained acetyl-CoA availability to maintain high levels of transcriptional output. Our data support a model in which SASP loci are highly responsive to fluctuations in acetyl-CoA levels, rendering them especially vulnerable to interventions that limit acetyl-CoA supply.An important question raised by our work is whether mitochondrial metabolic regulation and mtDNA-driven innate immune signalling3,12,13 act through a single linear pathway to control SASP, or instead function as separate but cooperative inputs. Our data support the latter model, demonstrating that mitochondrial control of histone acetylation and mtDNA–cGAS–STING signalling function as independent pathways that converge to enable SASP gene expression. While mitochondrial acetyl-CoA availability allows chromatin accessibility at SASP loci, mtDNA-dependent innate immune signalling provides the inflammatory activation required to engage these transcriptionally permissive regions. Disruption of either pathway is sufficient to suppress SASP, yet activation of either alone is not sufficient to fully restore SASP expression, indicating that both signals are required.CTPI2, a selective inhibitor of SLC25A1 (ref. 20), has previously been shown to improve metabolic dysfunction in diet-induced steatohepatitis29, a context associated with obesity and altered systemic metabolism, yet to our knowledge, its effects on ageing-associated phenotypes had not been explored prior to this study. Here we find that CTPI2 improves functional outcomes in aged mice while broadly suppressing SASP expression across tissues, without evidence of large-scale metabolic remodelling or reduced senescent cell abundance. This response differs from obesity-associated states, in which SLC25A1 inhibition influences glucose and lipid metabolism29, consistent with chronic nutrient excess and increased anabolic demand. Although both ageing and obesity involve metabolic alterations, our findings suggest that mitochondrial citrate export serves distinct roles in these settings. In aged tissues, citrate export appears to be less critical for sustaining bulk metabolic flux and instead contributes to acetyl-CoA-dependent chromatin acetylation and inflammatory gene expression. Accordingly, SLC25A1 inhibition selectively attenuates SASP-associated transcriptional programmes while preserving core metabolic functions.These findings position SLC25A1 inhibition as a novel therapeutic target that modulates the inflammatory output of senescent cells through metabolic–epigenetic coupling. More broadly, they suggest that targeting metabolic inputs into chromatin regulation may represent a tractable strategy to mitigate age-associated inflammation and functional decline.MethodsCell culture and treatmentsHuman embryonic lung MRC5 fibroblasts (ATCC) and IMR90 fibroblasts (ATCC) were cultured in Dulbecco’s modified Eagle’s medium (Sigma Aldrich, D5796) supplemented with 10% heat-inactivated fetal bovine serum (FBS), 100 U ml−1 penicillin, 100 μg ml−1 streptomycin and 2 mM l-glutamine. The cultures were maintained at 37 °C in an atmosphere of 5% CO2. MRC5 fibroblasts were grown under atmospheric oxygen conditions, and IMR90 fibroblasts were cultured under low-oxygen (3%) conditions. Cells were tested regularly for mycoplasma contamination.For lentiviral transduction HEK293T cells (ATCC) were used, cultured in DMEM without antibiotic and supplemented with 10% heat-inactivated fetal bovine serum (FBS) and 2 mM l-glutamine.Stress-induced senescence was triggered by exposing cells to 20 Gy of X-ray irradiation and collected between 10 and 12 days post-irradiation. Chemotherapy-induced senescence was performed by treated cells with 250 nM of doxorubicin (MedChemExpress, HY-15142) for 24 h and collected 12 days after treatment. Replicative senescence was performed through serially passaging until the cells reached their replicative limit. Senescence was verified through the presence of p16 and p21, lack of proliferation and the expression of SASP genes.For chronic acetate treatment, MRC5 or Parkin IMR90 cells were treated with 20 mM of sodium acetate solution (Sigma, S7899) for 10 to 12 days, with media refreshing every 48–72 h.For chronic citrate treatment, MRC5 were supplemented with 10 mM of sodium citrate (Sigma, W302600) for 10 to 12 days, with media refreshing every 48–72 h.For SLC25A1 and MPC pharmacological inhibition, MRC5 fibroblasts were irradiated with 20 Gy X-ray irradiation and treated with CTPI2 (Selleckchem, S2968) or UK5099 (Sigma, PZ0160) at the indicated concentrations (15 or 30 μM for CTPI2 and 100 μM for UK5099). CTPI2 and UK5099 were added one day after irradiation and maintained in the cell culture medium for 12 days (refreshed every 48–72 h). The same protocol was used for STING pharmacological inhibition where cells were treated with SN011 (Cayman Chemical, NC2044999) at concentration of 10 μM. For acetyl-CoA measurements, proliferative MRC5 were treated or not with 20 mM of sodium acetate-1-C13 (Sigma, 279293) or sodium acetate C12 (Sigma, S7899) and collected after 3 h. The analysis was performed in 4 million cells per condition.Parkin-mediated mitochondrial clearanceParkin-mediated mitochondrial clearance was performed as previously described. In summary, proliferating or irradiated Parkin-overexpressing IMR90 fibroblasts were treated with 12.5 μM CCCP (Sigma Aldrich, C2759) one day post-irradiation (day 1) for a duration of 48 h, with CCCP being replenished every 24 h (day 1, day 2). Acetate was added at day 3 when mitochondria were cleared, and cells were collected at day 12 (media refreshed every 48–72 h).Lactate dehydrogenase cytotoxicity assayCytotoxicity was assessed using a lactate dehydrogenase (LDH) assay (Abcam, ab65939) following the manufacturer’s instructions. Cells were seeded in 24-well plates, irradiated on day 0, and mitochondrial clearance was induced on days 1 and 2 (day 1 and day 2) using CCCP. At day 11 post-irradiation, the culture medium was refreshed. On day 12, 50 µl of the medium was collected and mixed with 50 µl of LDH reaction mixture. Absorbance was measured at 450 nm using a plate reader.Subcellular fractionation and mtDNA extractionSubcellular fragmentation and mtDNA extraction were performed following the previously described protocol3.In summary, IMR90 were collected by trypsinization and washed once with PBS. Cells were then pelleted by centrifugation at 300g for 5 min at 4 °C. Cells were resuspended in mitochondrial isolation solution (MIS) (20 mM HEPES-KOH pH 7, 220 mM mannitol, 70 mM sucrose, 1 mM EDTA, 0.5 mM PMSF, 2 mM DTT) and transferred into a glass homogenizer on ice. Cells were broken open by strokes and efficiency was assessed under microscope with trypan blue staining. Cells were stroked until the homogenization was sufficient. The homogenate was then centrifuged twice at 800g for 5 min at 4 °C to remove all the cell debris and membranes. The supernatant was centrifuged at 16,100g for 10 min at 4 °C. The supernatant, which is the cytosolic fraction, was discarded and the pellet, which is the mitochondrial fraction, was washed once with MIS and centrifuged again at 16,100g for 10 min at 4 °C and the pellet was resuspended in 200 μl PBS.DNA extraction was performed in the mitochondrial fraction using the DNeasy Blood & Tissue Kit (Qiagen, 69504) according to the manufacturer’s instructions.mtDNA transfection and acetate supplementation following Parkin-mediated mitochondrial clearanceMitochondrial clearance was performed in Parkin-mediated cells one day after irradiation as previously described3. Cells were treated or not with 20 mM of sodium acetate solution (Sigma, S7899) every other day. On day 10 post-irradiation, cells were transfected with mtDNA with a concentration of 10 μg of mtDNA for 500,000 cells using DharmaFECT kb DNA transfection reagent (Horizon, T-2006-01), according to the manufacturer’s instructions.Measurement of mtDNA in the cytosolic fractionCytosolic fractionation was performed on 5 × 10⁵ cells per condition, and mtDNA levels were quantified using the Absolute Human Mitochondrial DNA Copy Number Quantification qPCR Assay Kit (ScienCell, 8948) according to the manufacturer’s instructions.CRISPR–Cas9-based genome editingThe following plasmids were used:hSLC25a1 CRISPR (sgRNA #231; Vector-Builder, VB900058-0699rvd), hMPC1 CRISPR (5′-CACCGGGGCTACTTCATTTGTTGCG-3′ AND 5′-AAACCGCAACAAATGAAGTAGCCCC-3′), hBAK CRISPR (Addgene, 129579), hBAX CRISPR (Addgene, 129580), Puro CRISPR (Addgene, 52961) (Plenti control).For lentiviral transduction, HEK293FT cells were transfected with the plasmids above together with the packaging and envelope plasmids VSVG and Gag-Pol (Sigma Aldrich) using Lipofectamine 3000 (Invitrogen, L3000015) according to the manufacturer’s instructions. Then, 2 days later, the supernatant from the transfected HEK293FT cells containing viral particles was filtered using a 0.45-μm pore PVDF filter, mixed with 10 μg ml−1 of polybrene and used to infect the cells of interest. After infection, cells were selected for successful CRISPR–Cas9 deletion using the following antibiotics: 1 μg ml−1 of puromycin.siRNA transfectionsiACLY (Sigma, SASI_Hs01_00239323) and a scrambled control siRNA (Sigma, SIC001) were used. Cells were transfected with siRNA at a final concentration of 30 nM using DharmaFECT 2 transfection reagent (Horizon, T-2002-03) at a ratio of 0.3 μl per 100 μl transfection medium, according to the manufacturer’s instructions.Irradiation-induced senescenceCells were first transfected in T75 flasks for 24 h, then exposed to 20 Gy X-ray irradiation the following day. Cells were reseeded into 6-well plates 1 day post-irradiation (day 1) and transfected a second time at day 8 post-irradiation for 24 h. Cells were collected at day 10 post-irradiation for analysis.Replicative senescenceReplicatively senescent cells were transfected twice, at day 1 and day 4, each for 24 h using the same conditions, and collected at day 6 for analysis.
Mitochondrial metabolism and epigenetic crosstalk drive SASP - Nature
In senescent cells, mitochondria-derived acetyl-CoA promotes histone acetylation and increases chromatin accessibility at inflammatory gene loci. Inhibition of SLC25A1 attenuates these effects, underscoring the therapeutic potential of targeting mitochondrial metabolism and its epigenetic crosstalk to delay age-related functional decline.
16,992 words~77 min read