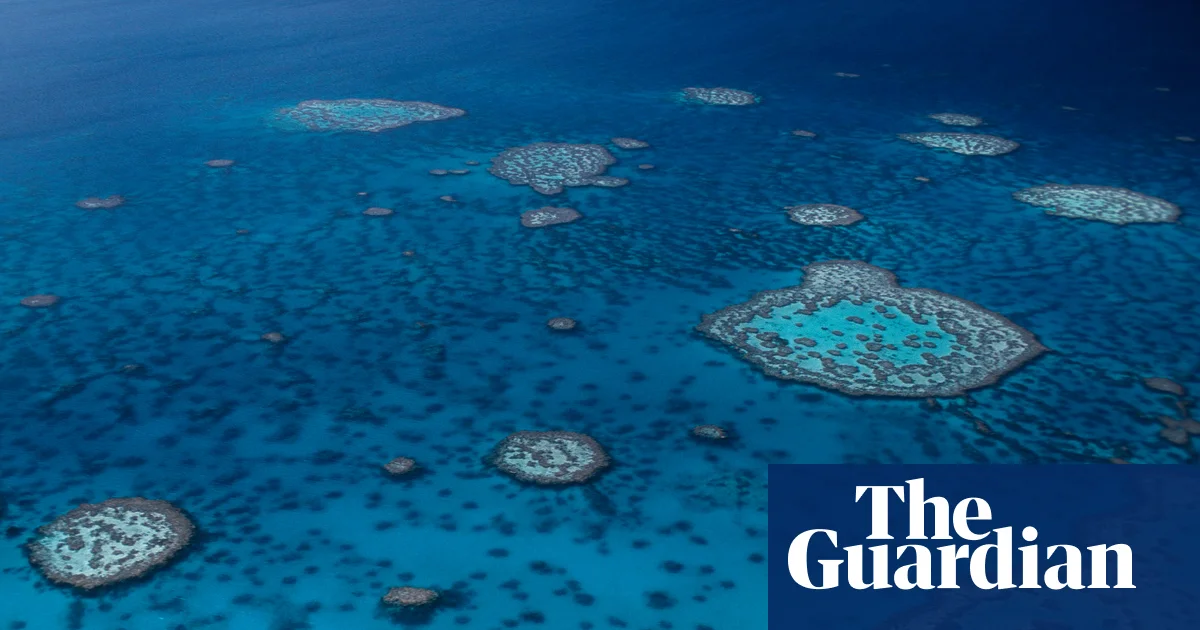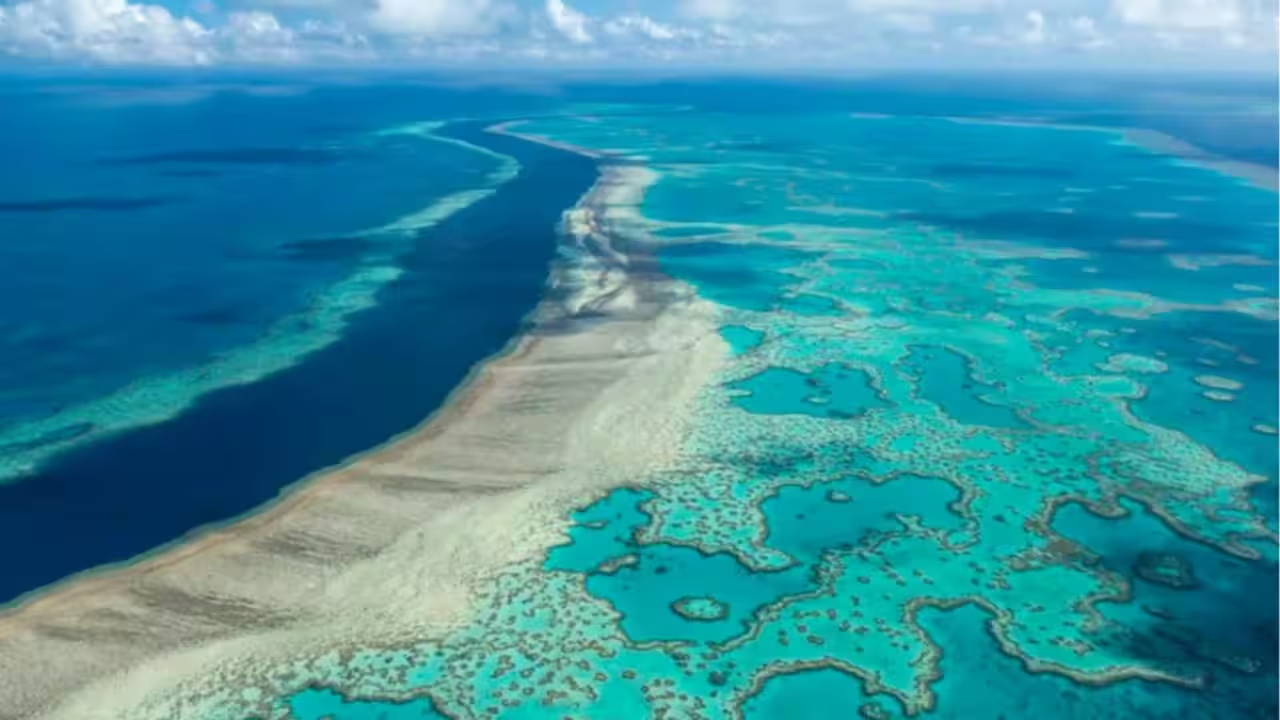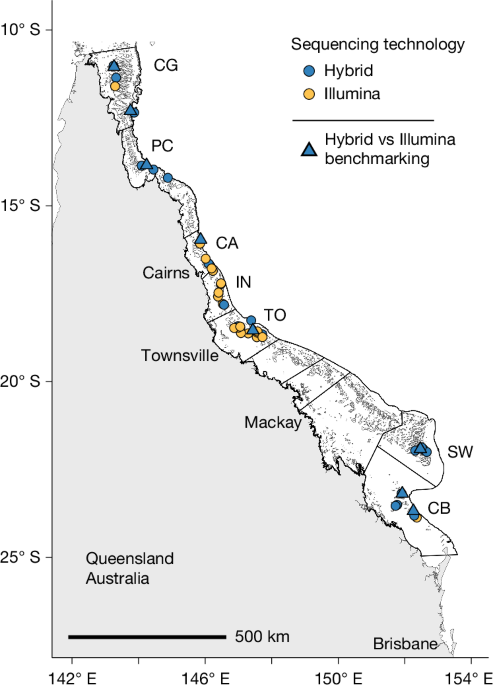
MainMicroorganisms dominate life in the oceans6, forming the foundation of marine food webs7 and driving global biogeochemical cycles8 through the metabolic interactions of bacterial, archaeal, viral and microbial eukaryotic communities. Understanding how these communities function, interact and change over time is critical for predicting ecological resilience, especially as oceans come under increasing pressure from climate change9. The overwhelming majority of microbial species found in marine ecosystems have yet to be cultured; however, the establishment of large-scale databases of prokaryote genomes via metagenomic sequencing has markedly improved our understanding of the identity, functional potential and distribution of marine microorganisms1,2,3,4,5. Among the prokaryotic inventories, however, many of the dominant species are conspicuously underrepresented, as evidenced by flow cytometry cell counts and metagenomic read mapping, including Pelagibacter, Prochlorococcus, SAR86 and others5,10. Further, the viral and eukaryote components of metagenomic surveys are less often included, with a few notable exceptions11,12,13,14,15,16,17. The oceans around Australia are also mostly absent in global marine genome surveys4,18, as are its coral reefs19,20, which are hotspots for biodiversity9. To address these gaps, we provide a detailed assessment of the pelagic microbiome of the Great Barrier Reef (GBR), the world’s largest coral reef, using hybrid long-read and short-read DNA sequencing to construct a holistic database of bacteria, archaea, eukaryotes, viruses and plasmids, collectively termed the Great Barrier Reef Microbial Genomes Database (GBR-MGD).We show that several prokaryote taxa are recalcitrant to recovery with Illumina short reads alone, owing to a combination of high strain heterogeneity and a bias against low-GC taxa, which can be rectified by inclusion of Nanopore long-read sequencing. This technology also enabled us to assemble Crassvirales genomes that form a distinct group within the order, as well as chromosome-level picoeukaryotic metagenome-assembled genomes (eMAGs) from multiple Bathycoccus structural variants and the as yet undescribed Ostreococcus clade B, often the most common picoeukaryote found on coral reefs. We were able to leverage the GBR-MGD prokaryote metagenome-assembled genomes (pMAGs) and machine learning techniques to identify reproducible shifts in community structure that reflect the GBR Marine Park Authority’s management plan designating reefs as open or closed to fishing. To our knowledge, this is the first demonstration of a large-scale ecosystem-wide effect of fisheries management on microbial communities of the surrounding seawater. This study marks a substantial advance in our ability to recover complete and near-complete prokaryotic, eukaryotic and viral genomes from seawater samples, enabling marine ecosystem research and management.Benchmarking hybrid metagenome assembliesThe absence of representative microbial genomic surveys of the GBR hampers our ability to understand how reef microbial communities are changing, especially in response to anthropogenic stressors such as climate change. To generate a comprehensive database of GBR marine microorganisms, seawater samples were collected from 48 sites spanning a north-to-south transect of the GBR (Fig. 1) for metagenomic sequencing (Supplementary Tables 1–3). To enhance metagenome-assembled genome (MAG) recovery, we used a hybrid assembly of long and short reads, which has been shown to substantially improve the quality of MAGs compared to short-read assemblies21.Fig. 1: Location of the 48 sites sampled across the GBR.Sampling was conducted alongside reef surveys performed by the AIMS LTMP. At each site, 4 × 5 l replicate seawater samples were collected for DNA extraction. Sites with Nanopore and Illumina sequence data (hybrid) are indicated with blue circles or triangles while sites with Illumina data only are indicated in yellow. Blue triangles represent the eight sites used for benchmarking Nanopore and Illumina hybrid versus Illumina-only assemblies. Sector names are indicated next to their locations. CA, Cairns; CB, Capricorn Bunker; CG, Cape Grenville; IN, Innisfail; PC, Princess Charlotte Bay; SW, Swain; TO, Townsville.We hypothesized that common but difficult-to-recover marine taxa such as Pelagibacter could be obtained using Nanopore long-read sequencing to span strain-variable regions based on the expectation of high strain heterogeneity22. To test this hypothesis, we selected eight seawater samples for Illumina-only and hybrid (Illumina plus Nanopore) assemblies and compared the recovery of medium- to high-quality pMAGs with a focus on lineages previously found to be difficult to recover as MAGs. The total number of base pairs in both Illumina-only and hybrid assemblies was standardized to 30 Gbp to remove sequencing depth as a factor. Contiguity of the hybrid-assembled pMAGs was 29-fold higher than that of the Illumina-only pMAGs (N50 of 730 versus 25 kb), exceeding the genome length of some marine taxa (for example, Nanoarchaeota23; Fig. 2a, Supplementary Tables 4 and 5 and Extended Data Fig. 1). Commensurately, the average number of medium to high-quality pMAGs per sample increased about twofold in hybrid assemblies (64 to 123) with the increase even more apparent for high-quality pMAGs (13 to 40; Fig. 2a and Extended Data Fig. 1).Fig. 2: Plots illustrating recovery and sequencing bias between Illumina-only and Nanopore hybrid pMAGs.a, Box-and-whisker plots showing number of recovered pMAGs per sample for taxa that are underrepresented in Illumina-only assemblies (n = 8 samples from different sites used for comparative Illumina-only versus hybrid assembly benchmarking). Centre lines in the boxes represent median values, top and bottom box boundaries represent top and bottom quartiles, respectively, whiskers extend to 1.5× interquartile range, and minima and maxima are presented as individual data points. b, Plots of nucleotide diversity (a measure of genetic diversity within microbial populations implemented in inStrain) and average GC percentage for hybrid (left; n = 382) and Illumina-only (right; n = 179) benchmark pMAGs after species-level dereplication (95% ANI), highlighting taxa that are challenging to recover using short reads in a. Circle opacity and size are scaled according to CheckM2 completeness. c, Plot showing Nanopore overrepresentation as a function of average MAG GC percentage across all benchmark hybrid (n = 987) and Illumina-only (n = 516) pMAGs, where overrepresentation is defined as the ratio of pMAG relative abundance in Nanopore versus Illumina reads. All MAGs have CheckM2 quality scores >50 and contamination <10%. Circle colours in panels b and c correspond to taxa colours in a.The increased number of hybrid pMAGs included lineages that were previously identified as difficult to recover with short-read-only sequencing, including Pelagibacterales, Parasynechococcus, Prochlorococcus and SAR86, along with other lineages that were not previously recognized as difficult to recover. For example, pMAGs from the Alphaproteobacteria class HIMB59, TMED109, TMED127 and MED-G09, the family AAA536-G10 within the order Puniceispirillales (formerly SAR116), and the Gammaproteobacteria order GCA-002705445, were not recovered from Illumina-only assemblies but were consistently recovered in hybrid assemblies (Fig. 2a). Notably, genomes belonging to the order Pelagibacterales and phylum Marinisomatota (formerly Marinimicrobia and SAR406) were recovered infrequently in Illumina-only assemblies, whereas 5 to 17 pMAGs were recovered per sample from the hybrid assemblies (Fig. 2a), resulting in substantial missed diversity using short read only assemblies—25 versus 2 different species across the 8 samples for Pelagibacterales and 13 versus 7 species in Marinisomatota (Supplementary Tables 4 and 5). Within the Cyanobacteriota, Prochlorococcus pMAGs were generally not recovered from Illumina-only assemblies but were recovered from all hybrid assemblies. Notably, whereas Parasynechococcus (formerly Synechococcus_E) pMAGs could be recovered from both short-read and hybrid assemblies, only the hybrid assemblies recovered representatives of Parasynechococcus species sp002724845 (Fig. 2a), the most dominant prokaryote lineage in GBR seawater, averaging 8.9 ± 5.9% relative abundance (maximum 35.9%) across the complete GBR-MGD dataset. By comparison, the next most abundant Parasynechococcus species averaged only 0.2% (Supplementary Table 6).We next investigated whether strain heterogeneity was the driving factor behind the improved recovery of pMAGs using Nanopore hybrid assemblies. One way to assess strain heterogeneity is to quantify single nucleotide polymorphism frequencies, and indeed, a high proportion of hybrid pMAGs from difficult-to-recover taxa represent populations with high nucleotide diversity (>0.02; Fig. 2b), a measure of genetic diversity within microbial populations implemented in inStrain24. By contrast, Illumina-only pMAGs rarely have nucleotide diversity values greater than 0.02, indicating a threshold above which short-read pMAG recovery is severely affected (Fig. 2b). However, several difficult-to-recover taxa have sufficiently low strain heterogeneity (0.005 to 0.02 inStrain nucleotide diversity; Fig. 2b) to be recovered by Illumina-only assembly, suggesting a secondary reason for improved pMAG recovery in hybrid assemblies. By mapping both the Illumina and Nanopore reads used in hybrid assemblies back to their respective pMAGs, we found that difficult-to-recover taxa were consistently under-represented in Illumina datasets (up to 18× less than in Nanopore datasets; Fig. 2c). Plotting GC content and fold Nanopore overrepresentation for all pMAGs, defined as the relative abundance in Nanopore reads divided by the relative abundance in Illumina reads, we found that low-GC pMAGs were better represented in Nanopore than Illumina data (Fig. 2c). For example, Marinisomatota pMAGs are up to 18× less abundant (average 6×) in Illumina reads than Nanopore, Prochlorococcus are up to 16× less abundant (average 7×), Gammaproteobacteria GCA-002705445 are up to 15× (average 6×) less abundant, and Pelagibacter are up to 7× (average 3×) less abundant. In addition to high nucleotide diversity, this would account for the limitations of Illumina-only assemblies in recovering pMAGs from difficult taxa, as all have GC contents below 40%. This is consistent with a known GC bias in polymerase-based sequencing platforms, including Illumina25. When considering both GC bias and strain diversity as factors, short-read MAG recovery appears to be difficult above 0.005 inStrain nucleotide diversity and less than 40% GC, as few pMAGs were recovered within this range and those that were showed lower completeness values (Fig. 2b). The problem reaches a critical threshold above 0.02 nucleotide diversity and <40% GC, where no pMAGs could be recovered from the short-read assemblies, despite many difficult taxa in this range being readily recovered in hybrid assemblies (56 hybrid versus 0 Illumina pMAGs) (Fig. 2b). In summary, we show that assemblies that incorporate long reads substantially enhance the recovery of dominant and ubiquitous marine lineages that are often missed by short-read-only assemblies, not only because long reads can overcome elevated strain heterogeneity but because of GC bias inherent to Illumina sequencing.Recovery of prokaryote MAGsHaving established that Nanopore sequencing substantially improves representation of cosmopolitan marine lineages, we extended our efforts to additional samples to produce the GBR-MGD. Hybrid assemblies from 27 of the 48 GBR seawater samples yielded 4,713 bacterial and archaeal pMAGs, including 1,505 high-quality (>90% completeness with <5% contamination) and 345 circular pMAGs assumed to be complete. We supplemented these data with Illumina-only assemblies from the remaining 21 sites resulting in an additional 570 pMAGs (85 in high quality), bringing the total number of bacterial and archaeal pMAGs to 5,283 in the final GBR-MGD database. Of the taxa identified to be recalcitrant to pMAG recovery, we obtained 319 Pelagibacterales pMAGs (22 high quality, 7 circular), 445 SAR86 (128 high quality, 35 circular), 222 Marinisomatota (70 high quality, 14 circular), 21 Parasynechococcus sp002724845 (1 high quality, 0 circular), 26 Prochlorococcus (8 high quality, 0 circular), 135 Gammaproteobacteria order GCA-002705445 (67 high quality, 34 circular) and 45 Alphaproteobacteria family AAA536-G10 (4 high quality, 0 circular). The recovery of circular pMAGs also enabled us to identify lineages for which CheckM version 1 (CheckM1) systematically underestimates completeness, as circular pMAGs should technically have a completeness value of 100% (the exception being multipartite genomes containing two or more replicons). Indeed, all circular genomes from the following taxa had completeness estimates below 85%: Gammaproteobacteria orders SAR86 and GCA-002705445, Bacteroidota genus MED-G13, Chloroflexota order UBA1151, Desulfobacterota class UBA1144, and the archaeal order Poseidonales (Supplementary Table 7). Completeness estimates were substantially higher for circular genomes using CheckM2, averaging 91% versus 79% for CheckM1, though groups GCA-002705445 and SAR86 are still underestimated using CheckM2 (average approximately 75% completeness) despite being circular. This underscores the need to use CheckM2 for completeness estimates of marine pMAGs to avoid discarding systematically underestimated genomes, which is likely to have contributed to underrepresentation of certain taxa.Species-level dereplication (≥95% average nucleotide identity (ANI)) of the final set of GBR-MGD pMAGs resulted in a set of 876 unique species (Supplementary Table 6). To determine the novelty of the GBR-MGD data, we compared all pMAGs to the approximately 32,000 pMAGs (≥50 quality based on CheckM1 or CheckM2) present in the Ocean Microbiomics Database4 (OMD), revealing that 584 of the GBR-MGD species (66.7%) were not previously represented (<95% ANI to OMD sequences) (Supplementary Table 8). These may therefore represent either newly recognized marine species potentially specific to the GBR or taxa that are present elsewhere but are not represented in public databases owing to difficulties with assembly. Notably, of the 328 species clusters with members from both the GBR-MGD and OMD, GBR-MGD pMAGs were the best representative 65% of the time (213 clusters) based on CoverM Cluster scoring criteria, which take into account genome completeness, contamination and number of contigs in each pMAG. Thus, the GBR-MGD comprises a wealth of new species diversity captured in high-quality pMAGs. Mapping of the GBR-MGD Illumina reads from all samples to the dereplicated pMAGs (Supplementary Table 6) showed that an average of 47 ± 11% (maximum 66%) of the community was represented by prokaryotic taxa. This result exceeds previous read-mapping statistics of marine metagenomes against large prokaryote genome databases, including Tara Oceans (2,631 MAGs; 7% average mapping)1, GEM26 (8,578 MAGs; approximately 20% average mapping), single amplified genome (SAG)-only Global Ocean Reference Genomes Tropics Database27 (20,288 SAGs; approximately 20–40% average mapping), and is nearly on par with the OMD4, a gold standard aggregated set of >35,000 MAGs and SAGs from all previous marine studies (approximately 58% average mapping for the 0.2–3 µm size fraction). Mapping of the GBR-MGD Illumina reads to OMD MAGs and SAGs resulted in an average 40.4 ± 7.7% (maximum 53.7%) of the GBR community represented by OMD genomes, indicating that the 876 GBR-MGD pMAGs capture regional microbial diversity not yet present in the OMD. Additionally, average read mapping rates of seawater metagenomes from seven Australian National Reference Stations to the GBR-MGD pMAGs ranged from 1.3% to 32.8% (Extended Data Fig. 2), indicating that seawater microorganisms on the GBR are distinct compared with these marine monitoring sites across Australia.Microbial community composition of the GBR differed across the seven sectors surveyed (adjusted P < 0.05, pairwise permutational multivariate analysis of variance (PERMANOVA); Fig. 3a), although a single Parasynechococcus species (sp002724845) was dominant in six of the sectors (8.5% to 14.7% average relative abundance) (Supplementary Table 6) and adjacent sectors tended to be compositionally similar (Fig. 3a). Communities in the seventh sector (TO) were distinct and significantly (adjusted P < 0.1, MaAsLin 3) enriched in Prochlorococcus_A sp003278705 (4.5% average relative abundance versus 0.5% in other sectors), Pelagibacter sp902612605 (0.6% versus 0.2%) and Actinomarina sp003213625 (0.5% versus 0.3%) (Supplementary Table 9). To determine potential drivers of the observed compositional variation, we compared two of the most divergent sectors, TO and IN. Water chemistry data fitted to community composition indicated that TO communities (Fig. 3a) were associated with fivefold higher phosphate and sixfold lower ammonium concentrations than IN (Supplementary Table 10). This was reflected in their metagenomes, with IN having higher abundances of Pst phosphate transport system and carbon-phosphorus lyase complex genes than TO (adjusted P < 0.1, DESeq2; Supplementary Table 11). These proteins facilitate the import of inorganic phosphate28 and metabolism of phosphonate compounds as a source of phosphate29, respectively, under phosphate-limiting conditions. Conversely, nitrate reductases were less abundant in IN compared with TO (Supplementary Table 11), possibly linked to inhibition of these enzymes by ammonium30.Fig. 3: Microbial community composition on the GBR and indicators of reef protection zoning.a, Principal component analysis visualization of microbial community composition (n = 48 reef sites × 4 replicates). Chla, chlorophyll a; DOC, dissolved organic carbon; PN, particulate nitrogen; POC, particulate organic carbon; PP, particulate phosphorus; TDN, total dissolved nitrogen; TDP, total dissolved phosphorus. b, Relative abundances of indicator taxa enriched in NTMRs (n = 23) compared with Fished reefs (n = 25) across the seven surveyed GBR sectors. c, Average genome size and GC content of the top 60 most influential indicator pMAGs (95% ANI dereplicated) from NTMR (n = 34 indicator pMAGs) and Fished (n = 26 indicators) reefs. Values quoted directly above the box plots are mean ± s.d. d, Heat map of MINT sPLS partial correlation coefficient values for each indicator pMAG showing positive (red) or negative (blue) correlation with seawater physicochemical variables. Si, silica; TSS, total suspended solids. e, Heat map showing microbial community composition of NTMRs (n = 23) versus Fished reefs (n = 25) based on relative abundances at order ranks. Asterisks indicate statistical association (q < 0.05, modelled using generalized linear models implemented in MaAsLin 3; P values generated using two-tailed tests and corrected for multiple comparisons with Benjamini–Hochberg false discovery rate) with either NTMRs (right side of heat map) or Fished reefs (left side of heat map). In box plots (b,c), centre lines represent median values, top and bottom box boundaries represent top and bottom quartiles, respectively, whiskers extend to 1.5× interquartile range, and minima and maxima are represented by data points.Microbial indicators of reef zoningMarine protected areas are refuge zones that were created to protect sensitive reef-dwelling animals from human disturbance. When strictly enforced, such areas are known to be effective tools for reef conservation that can buffer the negative effects of fishing and potentially marine heatwaves on sensitive species31. Consequently, the GBR Marine Park Authority has categorized reefs into zones32 that are open to fishing (Fished), and No-Take Marine Reserves (NTMRs), which are closed to fishing to protect ecosystems and maintain stable populations of commercially harvested fish (Supplementary Table 10). Marine microbial communities have been shown to shift rapidly and predictably in response to environmental change such as nutrient loads and temperature, which could be leveraged to inform management decisions33. To test whether the GBR-MGD can predict reef protection status, we analysed the abundances of prokaryotic, viral and eukaryotic MAGs and contigs (Methods, ‘Final GBR-MGD database compilation’) from co-located Fished and NTMR reefs (Extended Data Fig. 3) using multivariate integration sparse partial least squares discriminant analysis (MINT sPLS-DA) to perform feature selection controlling for sector, followed by classification with random forest. This approach predicted protection status with 74.6 ± 1.4% accuracy (mean ± s.d.), suggesting an ecosystem-wide effect that extends into the surrounding seawater to influence microorganisms. As prokaryotic communities are more easily profiled (for example, for development of environmental assessment tools34) and have been better characterized compared with viruses and eukaryotes, we repeated this analysis with pMAGs alone, resulting in 71.4 ± 0.9% accuracy (mean ± s.d.). Notably, the majority of pMAGs indicative of NTMR status belong to Pelagibacterales (7.9% versus 5.4% average relative abundance in NTMR versus Fished zones), SAR86 (1.6% versus 1.1%), HIMB59 (0.6% versus 0.5%), TMED109 (0.1 % versus 0.06%) and Marinisomatota (0.6% versus 0.4%) (Fig. 3b), all identified in the present study as lineages displaying high strain heterogeneity and low GC content that are underrepresented in Illumina short-read sequence data (Fig. 2). Many of these taxa have undergone genome streamlining (reduced genome size and lower GC content; Fig. 3c) as an adaptation to oligotrophic habitats to reduce their requirement for nutrients35,36,37 (Fig. 3d). By contrast, the majority of taxa indicative of Fished reefs have GC contents above 45% with no evidence of genome streamlining, including members of the genera UBA11663 and UBA8752, species UBA10364 sp003445735 in the class Bacteroidia, the family Halieaceae in the Gammaproteobacteria, and the species HIMB11 sp000472185 in the Alphaproteobacteria. In fact, at 60%, 63% and 45% average GC respectively, the UBA11663, UBA8752 and UBA10364 pMAGs have GC contents 9 to 27% higher than the average member of the Bacteroidia (36%) from the GBR-MGD (Supplementary Table 7). The association of NTMR reefs with streamlined, low-GC taxa that require less nitrogen for DNA synthesis36,37,38,39 than their higher-GC counterparts on Fished reefs suggests that protection status may influence reef nutrient levels. Leveraging nutrient measurement data taken alongside these microbial samples, we find that dissolved nitrogen (ammonia, nitrate and nitrite) is indeed lower in NTMR reefs compared with Fished reefs (Extended Data Fig. 4), suggesting that differences in nutrient levels between NTMR and Fished reefs select for taxa with different ecological and evolutionary strategies. Decreased fish densities and thus grazing are postulated to result in increased macroalgae, which in turn release nutrients that may account for higher nutrient levels in Fished reefs33,40,41,42.Although NTMRs were generally associated with prokaryotic oligotrophs and Fished reefs with copiotrophs (Fig. 3e and Supplementary Table 12; false discovery rate-corrected P < 0.05, MaAsLin 3), the enrichment of specific taxa was region-dependent. For example, several oligotrophic Pelagibacter species were only enriched in IN NTMRs whereas Prochlorococcus_A was the most abundant genus in TO NTMRs. Conversely, inferred copiotrophic species such as Luminiphilus sp011524755 (order Pseudomonadales) were enriched in IN Fished reefs and MED-G52 sp001627375 (order Rhodobacterales) enriched in TO Fished reefs43. This regional specificity was also reflected by limited overlap of the most abundant species (3 out of 20) that distinguish reef protection zoning in each sector (adjusted P < 0.1, MaAsLin 3) (Supplementary Table 13). Regional specificity was also reflected to some extent by enrichment of different gene families in different sectors (Supplementary Tables 14 and 15). For example, adenosine triphosphate-binding cassette transport systems for inositol-phosphate (K17238, K17239 and K17240) were enriched in IN NTMRs, and transport systems for polar amino acids, spermidine and putrescine (K02029, K02052 and K02053) were enriched in TO NTMRs (adjusted P < 0.1, DESeq2), broadly indicative of low nutrient availability but probably indicating regional differences in available nutrients. Similarly, different genes suggestive of copiotrophic conditions were enriched in the different sectors. For example, in IN Fished reefs genes linked to the degradation of aromatic compounds such as phenylacetyl-CoA epoxidase (paaABCDE, K02609–K02613; phenylacetate degradation pathway) and pcaDFG (K00448, K01055 and K07823; β-ketoadipate pathway) were enriched, and in TO Fished reefs phenol 2-monooxygenase (K03380) and 4-methoxybenzoate monooxygenase (K22553) were enriched. In addition, TO NTMRs were enriched in several Kyanoviridae protein orthologues (Supplementary Table 15), probably linked to the high relative abundance of Prochlorococcus44 (~4.5% relative abundance) in this sector. Together, these data indicate that whereas NTMR zoning results in broad enrichment of oligotrophic taxa, region-specific differences are more nuanced and highlight that markers tailored to regions could increase predictive power for reef management. More samples from NTMR and Fished reefs in each sector will be needed to test this idea.Recovery of DNA virusesViruses are the most abundant biological entities in marine environments, and have a large impact on marine ecology through interactions with their prokaryote and eukaryote hosts. For example, it is estimated that viruses kill 20% of marine microbial biomass per day, representing a substantial carbon turnover45. Current state-of-the-art viral detection tools have almost exclusively been benchmarked on short-read assemblies, and are known to be sensitive to contig length46,47. To assess their use on long-read assemblies, we first tested six widely used metagenomic viral prediction tools to identify viruses in the GBR-MGD—GeNomad, Virsorter2, ViralVerify, VIBRANT, PPR-Meta and DeepVirFinder—using CheckV to assess the number of complete viruses predicted by each tool. We further plotted the ratio of prokaryotic host to viral marker genes identified by CheckV within each putative viral contig to detect spurious assignments. DeepVirFinder showed substantially more false positives than the other tools tested, with the proportion of bacterial marker genes among putative viral contigs increasing with contig length, indicating bacterial origin (Extended Data Figs. 5 and 6). When these bacterial contigs were assessed by CheckV, longer contigs were increasingly likely to be designated as complete viral genomes, despite having a high ratio of bacterial to viral markers (Extended Data Figs. 5 and 6). We note that CheckV is not designed to identify viral versus non-viral sequences, but highlight this result because it is common practice to filter assemblies based on CheckV quality scores that could result in extensive misidentification of viral auxiliary metabolic genes if DeepVirFinder is applied to long-read assemblies. We therefore excluded DeepVirFinder from our pipeline as unsuitable for use with long-read metagenomes, and the remaining five tools were used in concert to produce a consolidated dataset of 808,585 single contig viral MAGs (vMAGs) from across the 48 GBR-MGD reefs, representing 362,802 species-level (95% ANI) viral operational taxonomic units (vOTUs) (Supplementary Table 16). Read mapping against the vOTU representatives accounted for 4–27% of each metagenome (averaging 13 ± 4%), highlighting that viruses comprise a substantial proportion of GBR seawater metagenomes45,48. The overall vOTU community composition significantly differed across sectors (P < 0.01, PERMANOVA) and closely tracked the prokaryotic communities (P < 0.01, Procrustes rotation; Extended Data Fig. 7).The majority of vOTUs were classified as Caudoviricetes (67% of sequences), of which only 6% were resolved below this class. This included the families Kyanoviridae (2.8%) encompassing the T4-like cyanophages that commonly infect Prochlorococcus44 and Synechococcus49; Autographiviridae (1.4%), common phages of Prochlorococcus, Synechococcus and Pelagibacter50,51,52,53; and the order Crassvirales (1%; see below). A further 6% of the vOTUs were classified as giant viruses belonging to the Nucleocytoviricota, which probably reflects our ability to recover low-GC genomes characteristic of this phylum. The remaining vOTUs (27%) were unclassified, which may indicate bona fide marine viral novelty or difficulties in discriminating viruses from other genetic elements. Therefore, we provide the CheckV and GeNomad marker gene frequency tables to enable users to filter vMAGs based on their own criteria (Supplementary Tables 17–19).Recovery of marine Crassvirales
The planktonic microbiome of the Great Barrier Reef - Nature
The Great Barrier Reef Microbial Genomes Database compiles prokaryotic, viral and eukaryotic genomes from seawater collected from the Great Barrier Reef, providing a rich resource for the study of marine microbial communities and ecosystem research and management.
13,945 words~63 min read