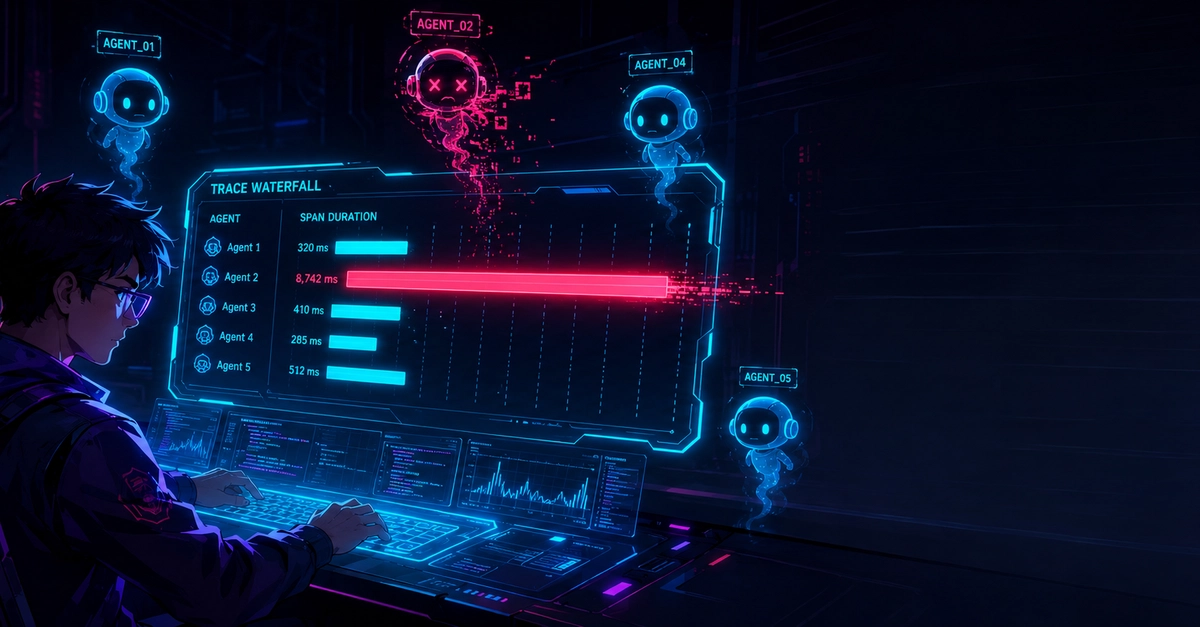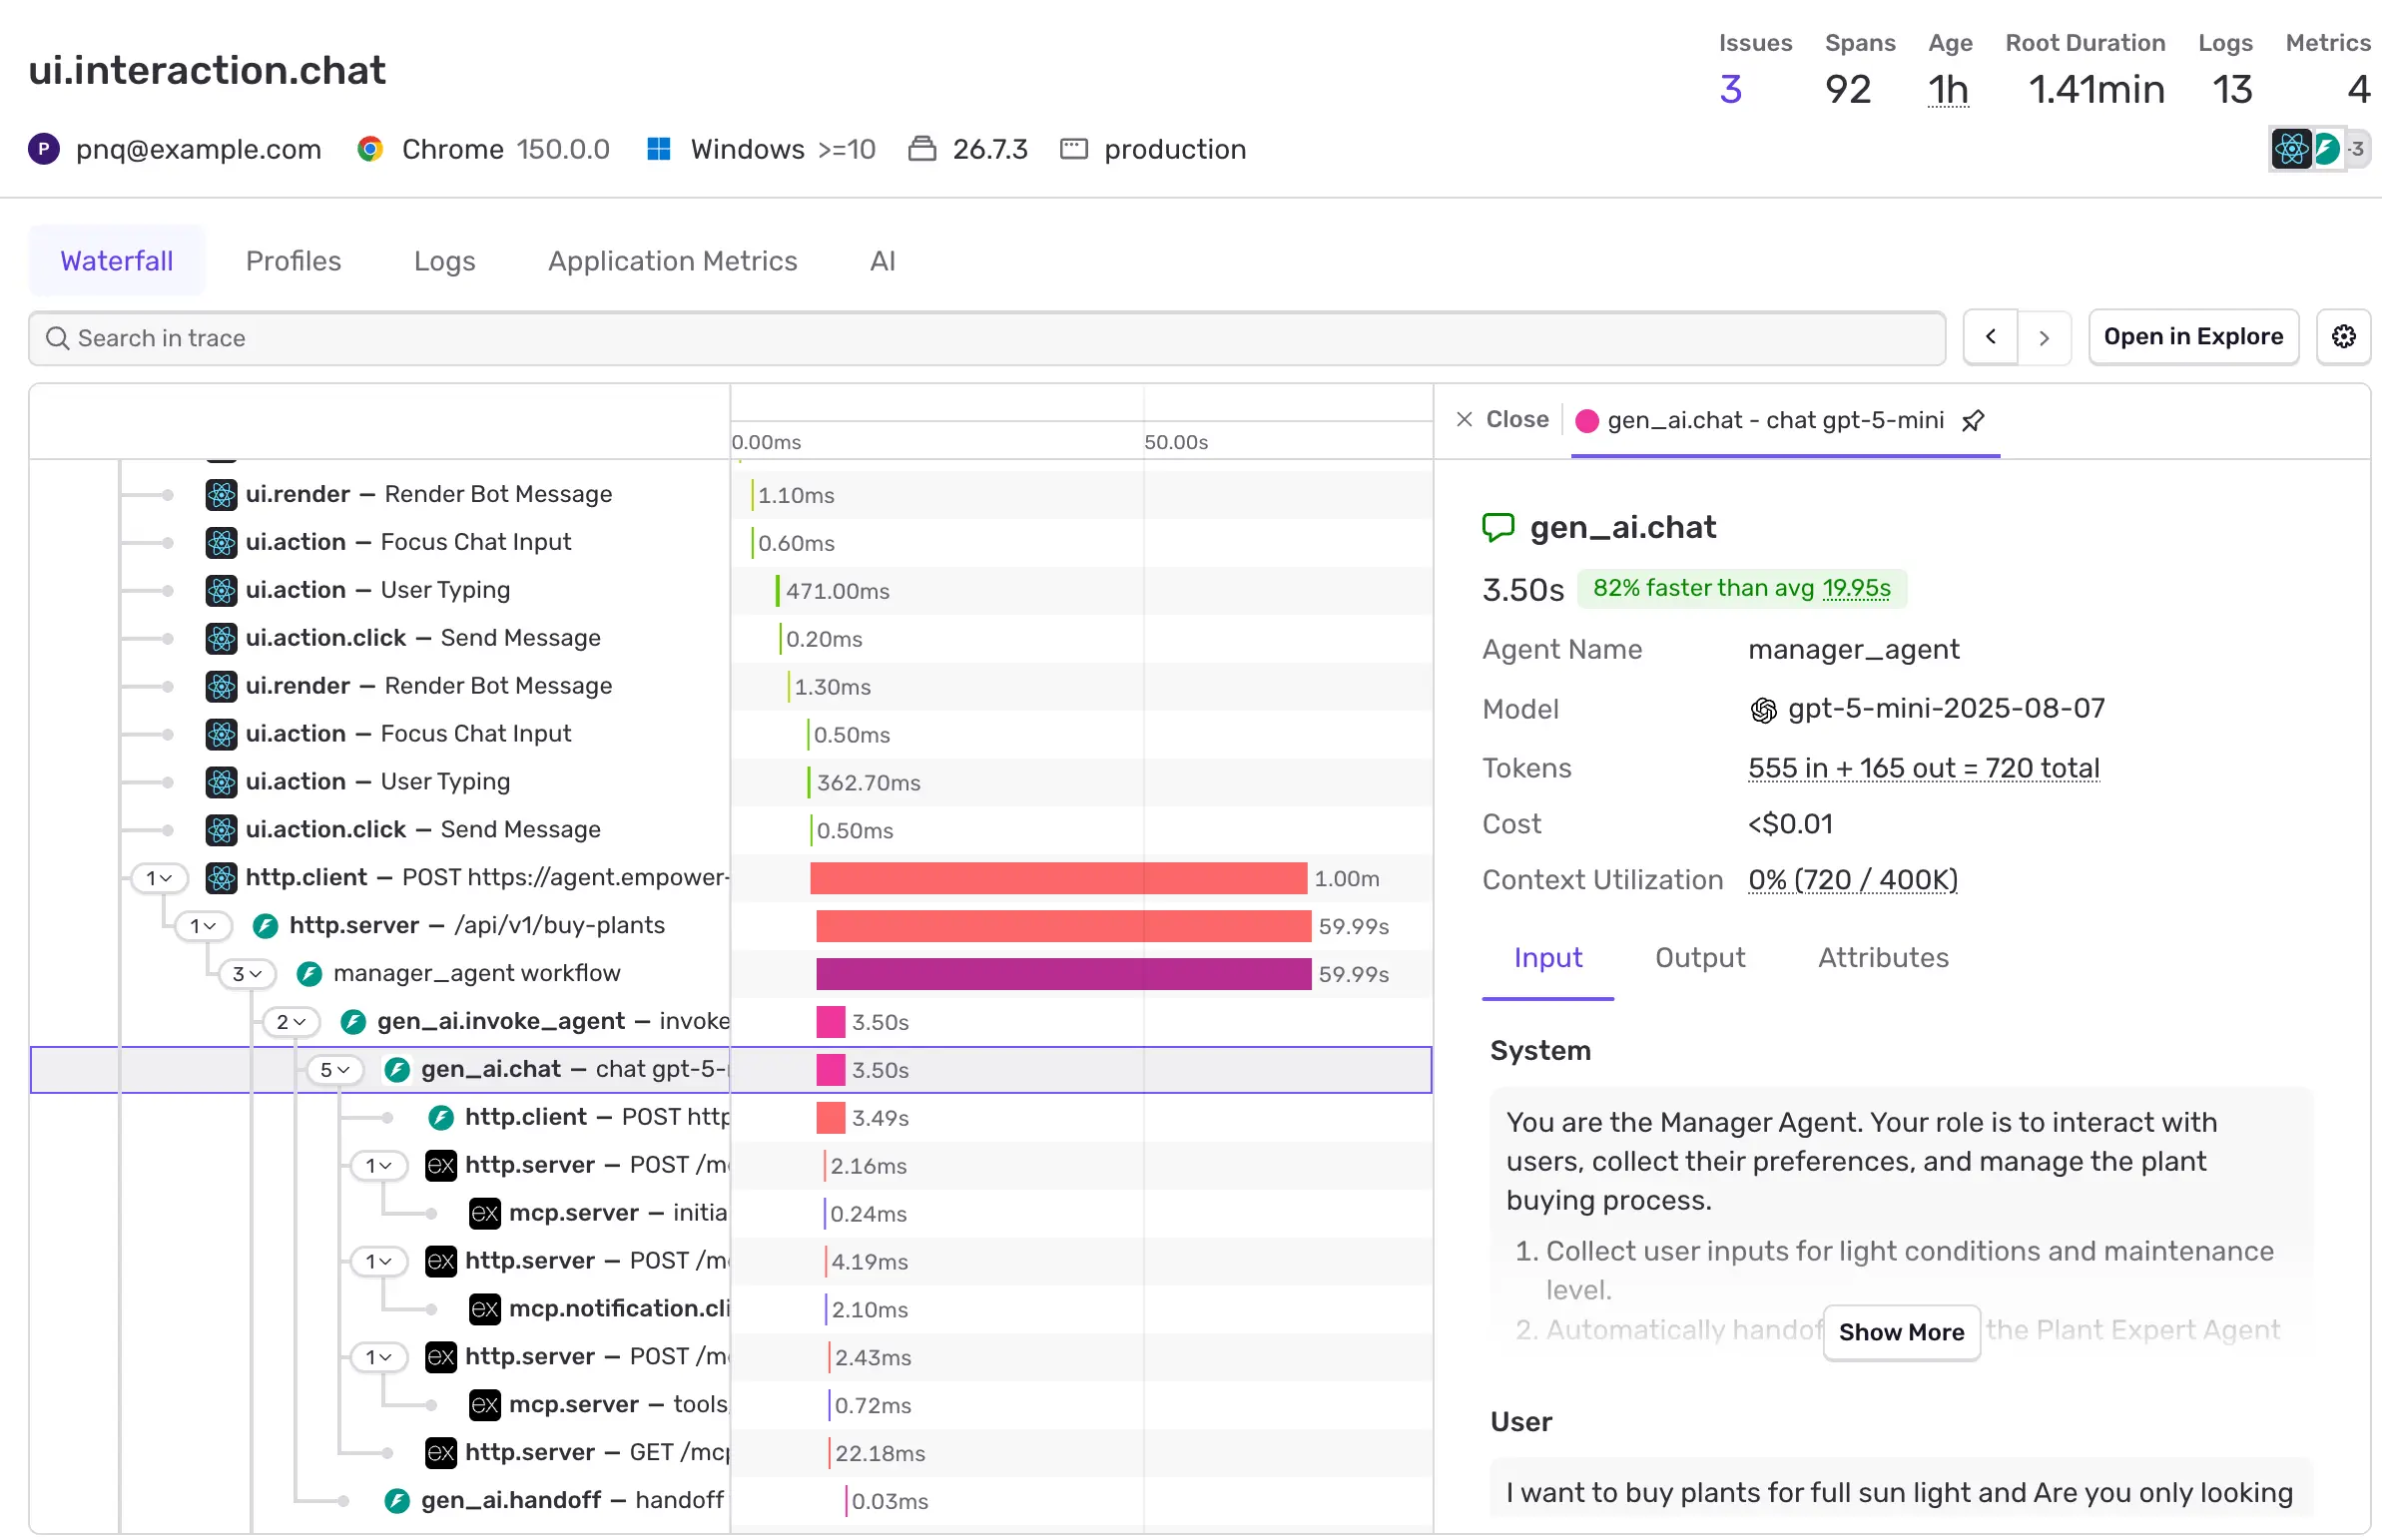
Agent tracing from system prompt to final outputBuilding with AI is unreliable. A dozen things can go wrong per run. Sentry traces the whole execution, linked to your app context, so you see the session, the run, and where it broke. See agent decisions and broader application context all in one trace A bad agent response might stem from a slow database query, a failed API call, or a frontend timeout. Your gen_ai.* spans appear within your existing application traces. Model calls, tool executions, and handoffs sit alongside your regular HTTP, database, and queue spans in the same hierarchy. Agent Tracing Docs Replay every user session as a readable conversation Conversations turn raw AI spans into a chat-like replay of any user session with your AI assistant. See the full message history as the user experienced it: inputs, responses, and tool calls in order. Click any message to jump to the underlying LLM generation and tool execution spans with timing and error context. Learn about Conversations Know what your agents cost and where the tokens go Pre-built dashboards show agent runs, error rates, model costs, token breakdowns (input, output, cached, reasoning), and per-tool execution stats. See which models are expensive, which tools fail often, and whether your prompt caching is working. See AI dashboard docs Find the tool that's quietly breaking your agent Surface per-tool error rates, P95 latency, and invocation frequency. A tool failing 5% of the time may not move your overall error rate, but it causes 1 in 20 agent runs to produce bad output. Catch it here first. See AI dashboard docs Sentry connects to both sides of your stack Sentry auto-instruments OpenAI Agents, Vercel AI SDK, LangChain, LangGraph, Pydantic AI, Anthropic, Google GenAI, Laravel AI and more. Install the SDK, enable tracing, and spans show up — no manual instrumentation needed. MCP tool calls appear as spans inside your agent traces. See which MCP servers your agent called, what they returned, how long they took, and whether they failed, all connected to the rest of the agent run. Build custom dashboards to track cost per user tier, per feature, or per agent. Tag spans with user_tier, feature_flag, or whatever dimensions matter to your business, and query against them. Getting started is a few lines of code Auto-instrumentation for Python and JavaScript. Install the SDK, enable tracing, start sending AI spans. Spans and dashboards populate automatically. Agent tracing follows a single AI agent run from start to finish as a connected trace, capturing every LLM call, tool execution, MCP interaction, and handoff as a span with its inputs, outputs, token counts, cost, and timing. Because agents make decisions across many steps, a flat log isn't enough: agent tracing shows the full execution path so you can see exactly which step failed or stalled. See how agent tracing works in Sentry.LLM monitoring measures individual model calls: latency, tokens, errors. Agent tracing tracks the complete agent lifecycle: multi-step reasoning, tool execution, sub-agent transfers, and how individual calls combine into workflows. Sentry does both. Individual LLM call data feeds into the same traces and dashboards as the full agent execution.Sentry agent tracing is complementary to eval workflows. Evals catch regressions against known test cases; agent traces show you the execution behind the score — which model was called, what the tool returned, where context was lost. When an eval flags a quality drop, the trace tells you why, and when something breaks that you didn't write an eval for, traces are how you find it first. Read more about evals and traces.Yes. Agent traces are part of your existing Sentry distributed traces. Your gen_ai.* spans appear alongside your HTTP, database, and queue spans in the same trace hierarchy. No separate product, no additional system. Add the SDK integration for your agent framework and agent spans start appearing in traces you already have.Sentry auto-instruments OpenAI Agents, Vercel AI SDK, LangChain, LangGraph, Pydantic AI, Anthropic SDK, Google GenAI, and more — in both Python and JavaScript/Node.js. If your framework isn't auto-instrumented, manual instrumentation takes about 10 lines per span type. See the full list.Yes. MCP tool calls appear as gen_ai.execute_tool spans inside your agent traces. You see which MCP servers were called, what data they returned, how long they took, and whether they errored — all connected to the agent run that triggered them. Get started with MCP observability.Conversations turns raw AI spans into a chat-like replay of any user session with your AI assistant. See the full message history as the user experienced it, and click any message to see the underlying spans. A single conversation can span multiple traces, Sentry stitches them using a stable gen_ai.conversation.id.Yes. Agent tracing, dashboards, and cost tracking are available on every Sentry plan, including the free Developer plan. See pricing. More on agent tracing Fix with full-stack context Get started with the only application monitoring platform where your agent traces live alongside your existing errors, logs, and session replays.
Agent Tracing: See Every Step of Your AI Agent Run
Trace every AI agent run from model calls and tool executions to sub-agent handoffs, all inside your existing Sentry traces
825 words~4 min read