If your .NET app talks to MongoDB, you almost certainly want to be able to measure DB performance so that you can effectively debug any performance issues you might run into.
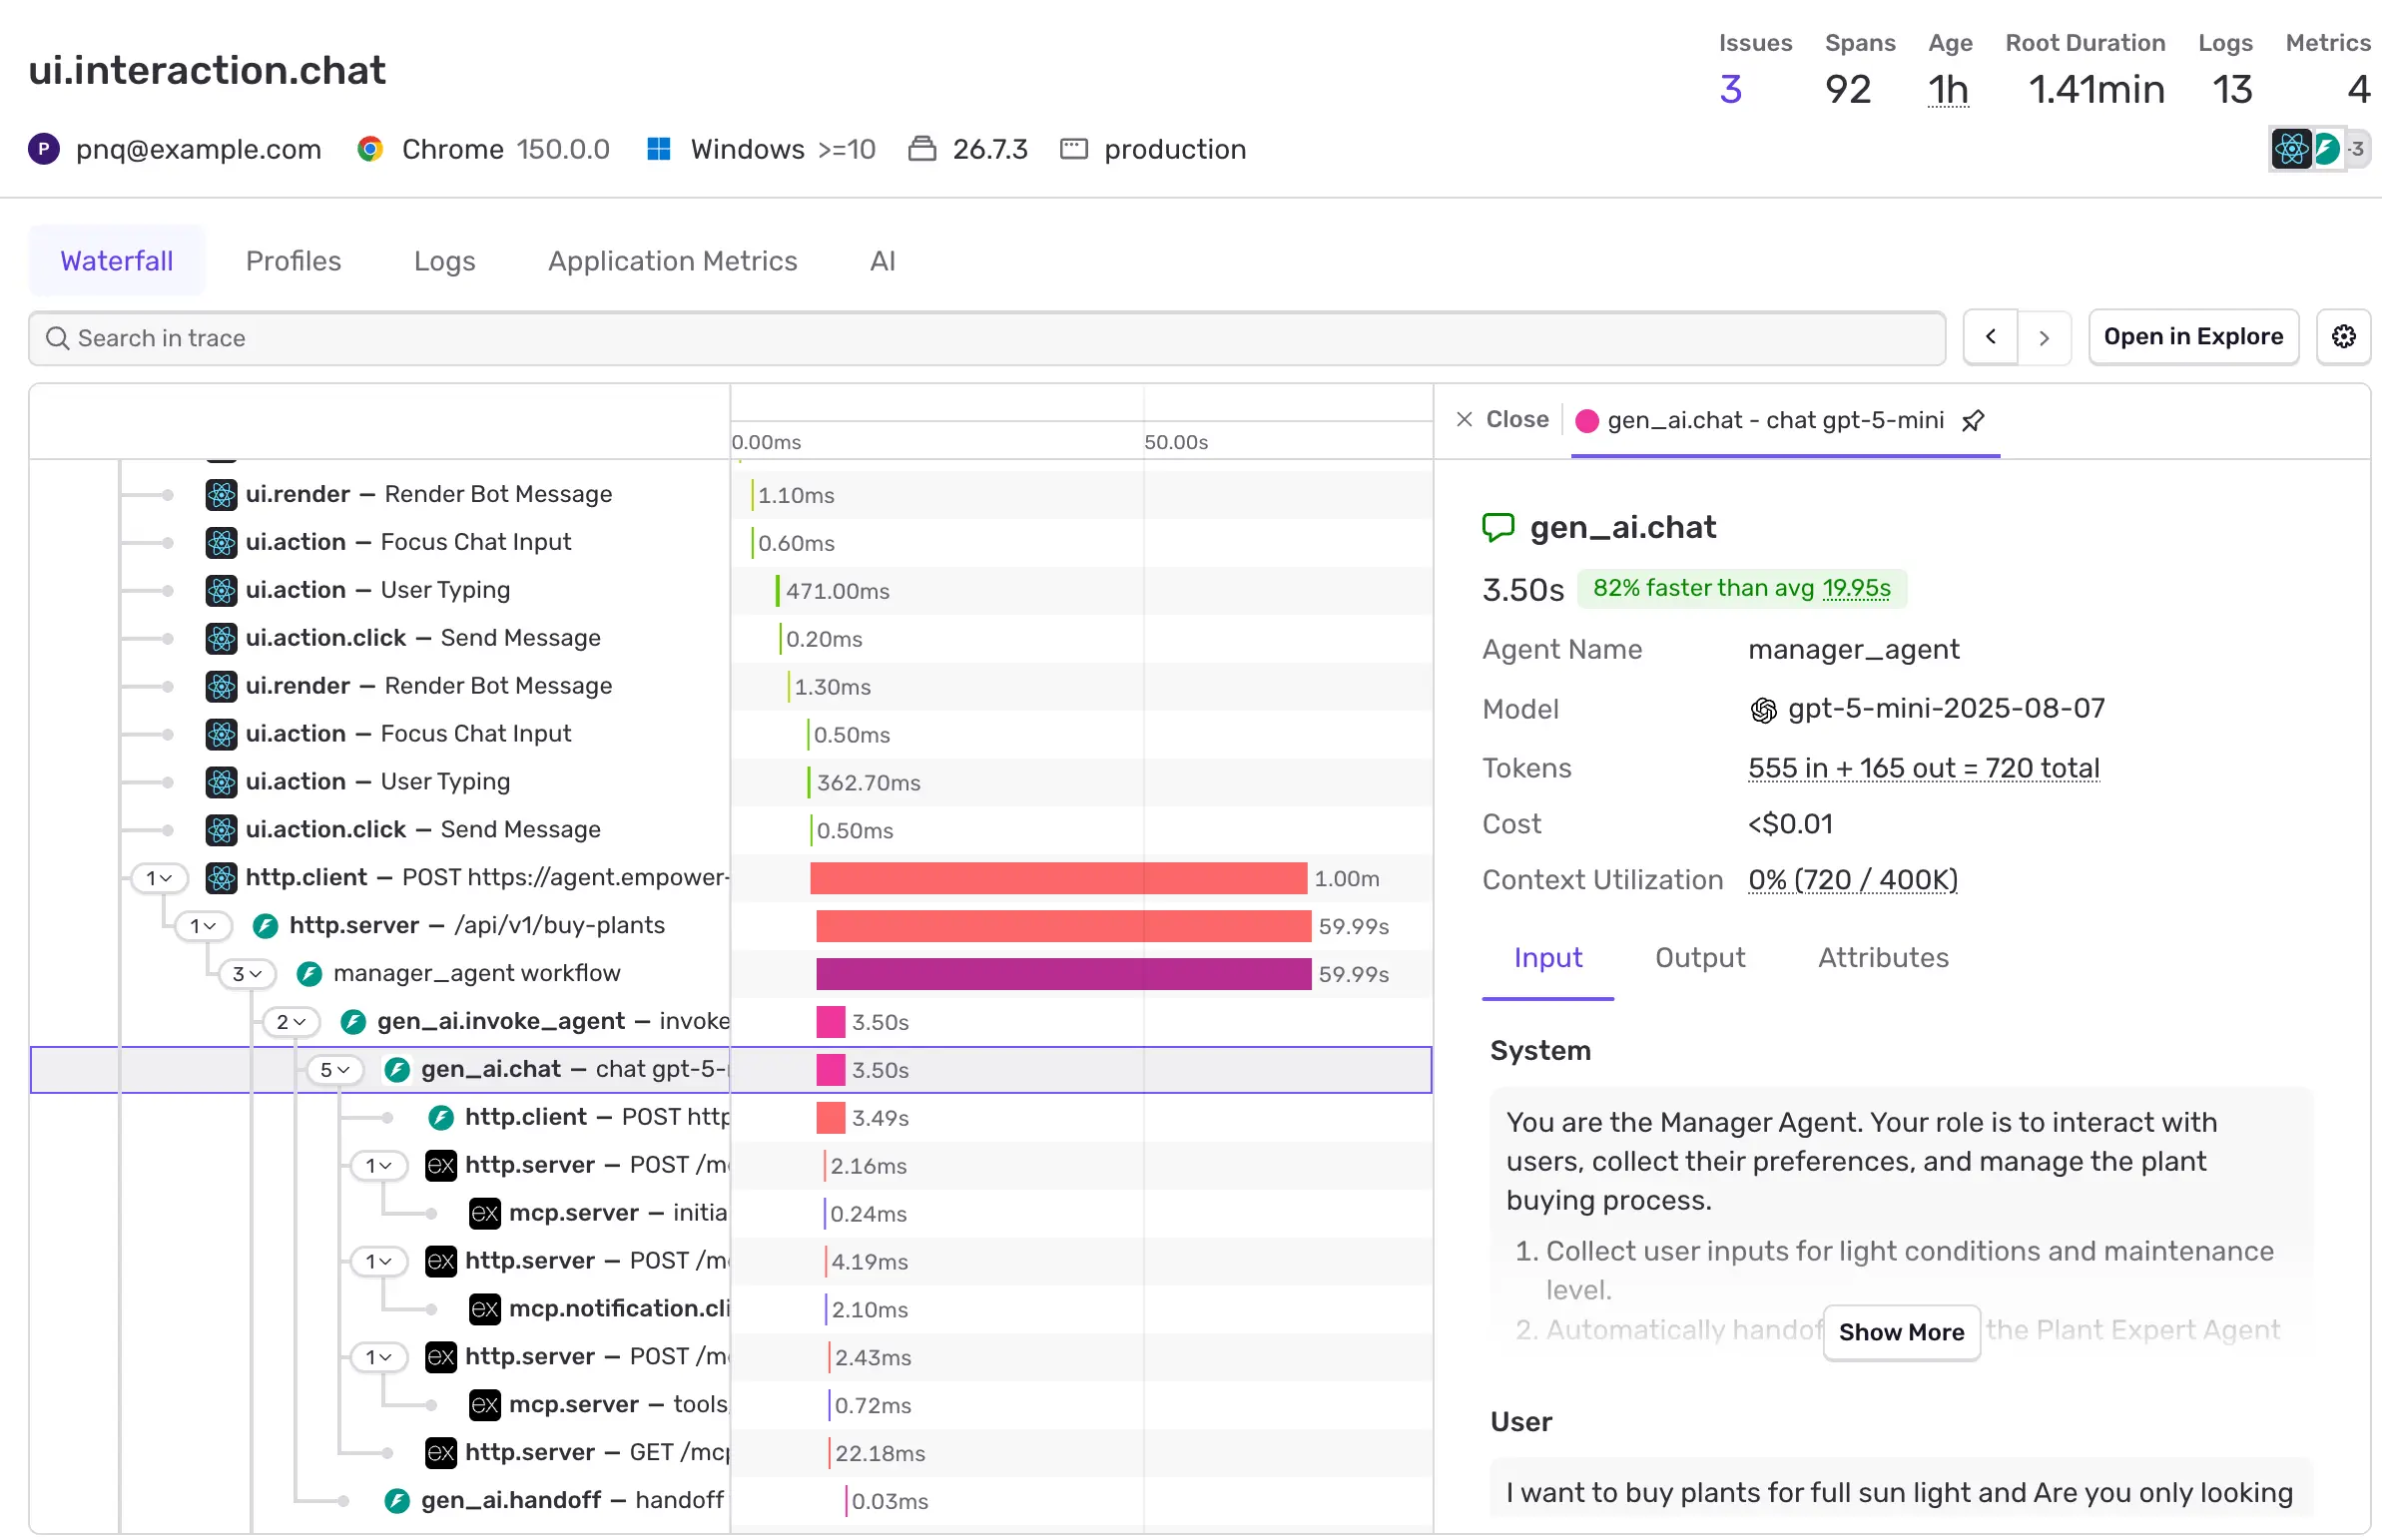
For that, you need to know which database command was running, how long it took, and whether this was a one-off blip or part of a broader pattern. Ideally, you also want to pivot from that trace to related errors and replays without stitching the story together by hand.
This post shows how to do exactly that using:
MongoDB’s built-in OpenTelemetry instrumentation
Sentry’s OTLP ingestion support in the .NET SDK