When an LLM-based agent takes 12 seconds to respond, where exactly does the time go?
Was it a slow vector database retrieval? Did your orchestration framework get stuck in an agent loop? Or was your LLM provider throttling your API requests?
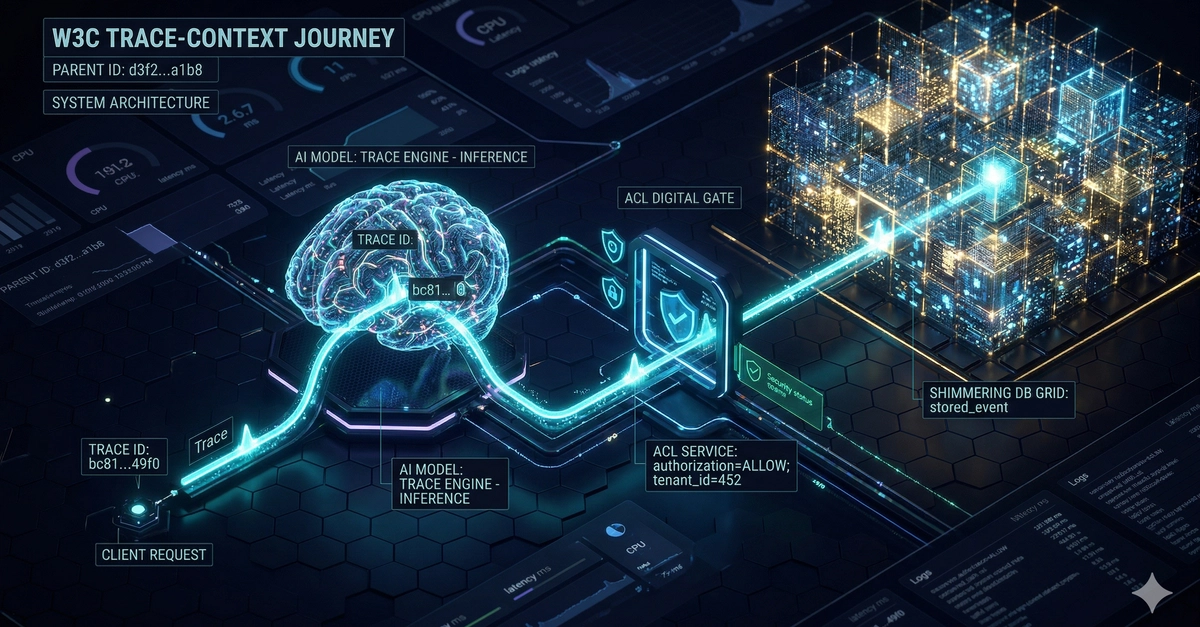
If your architecture relies on asynchronous background workers to process agent steps, finding the culprit is notoriously difficult. Standard HTTP auto-instrumentation falls flat the moment a job gets serialized and handed off to a background queue. The trace context is dropped, the execution path goes dark, and you're left digging through disconnected log lines trying to manually stitch timestamps together.
This is a common wall people hit while building asynchronous pipelines for things like real-time risk estimation or hallucination detection on LLM outputs. Getting past it means moving beyond basic auto-instrumentation into manual OpenTelemetry propagation, paired with SigNoz for visualization.
Here's how to bypass the generic setup guides, bridge asynchronous boundaries, and map out exactly what your AI agents are doing in production.