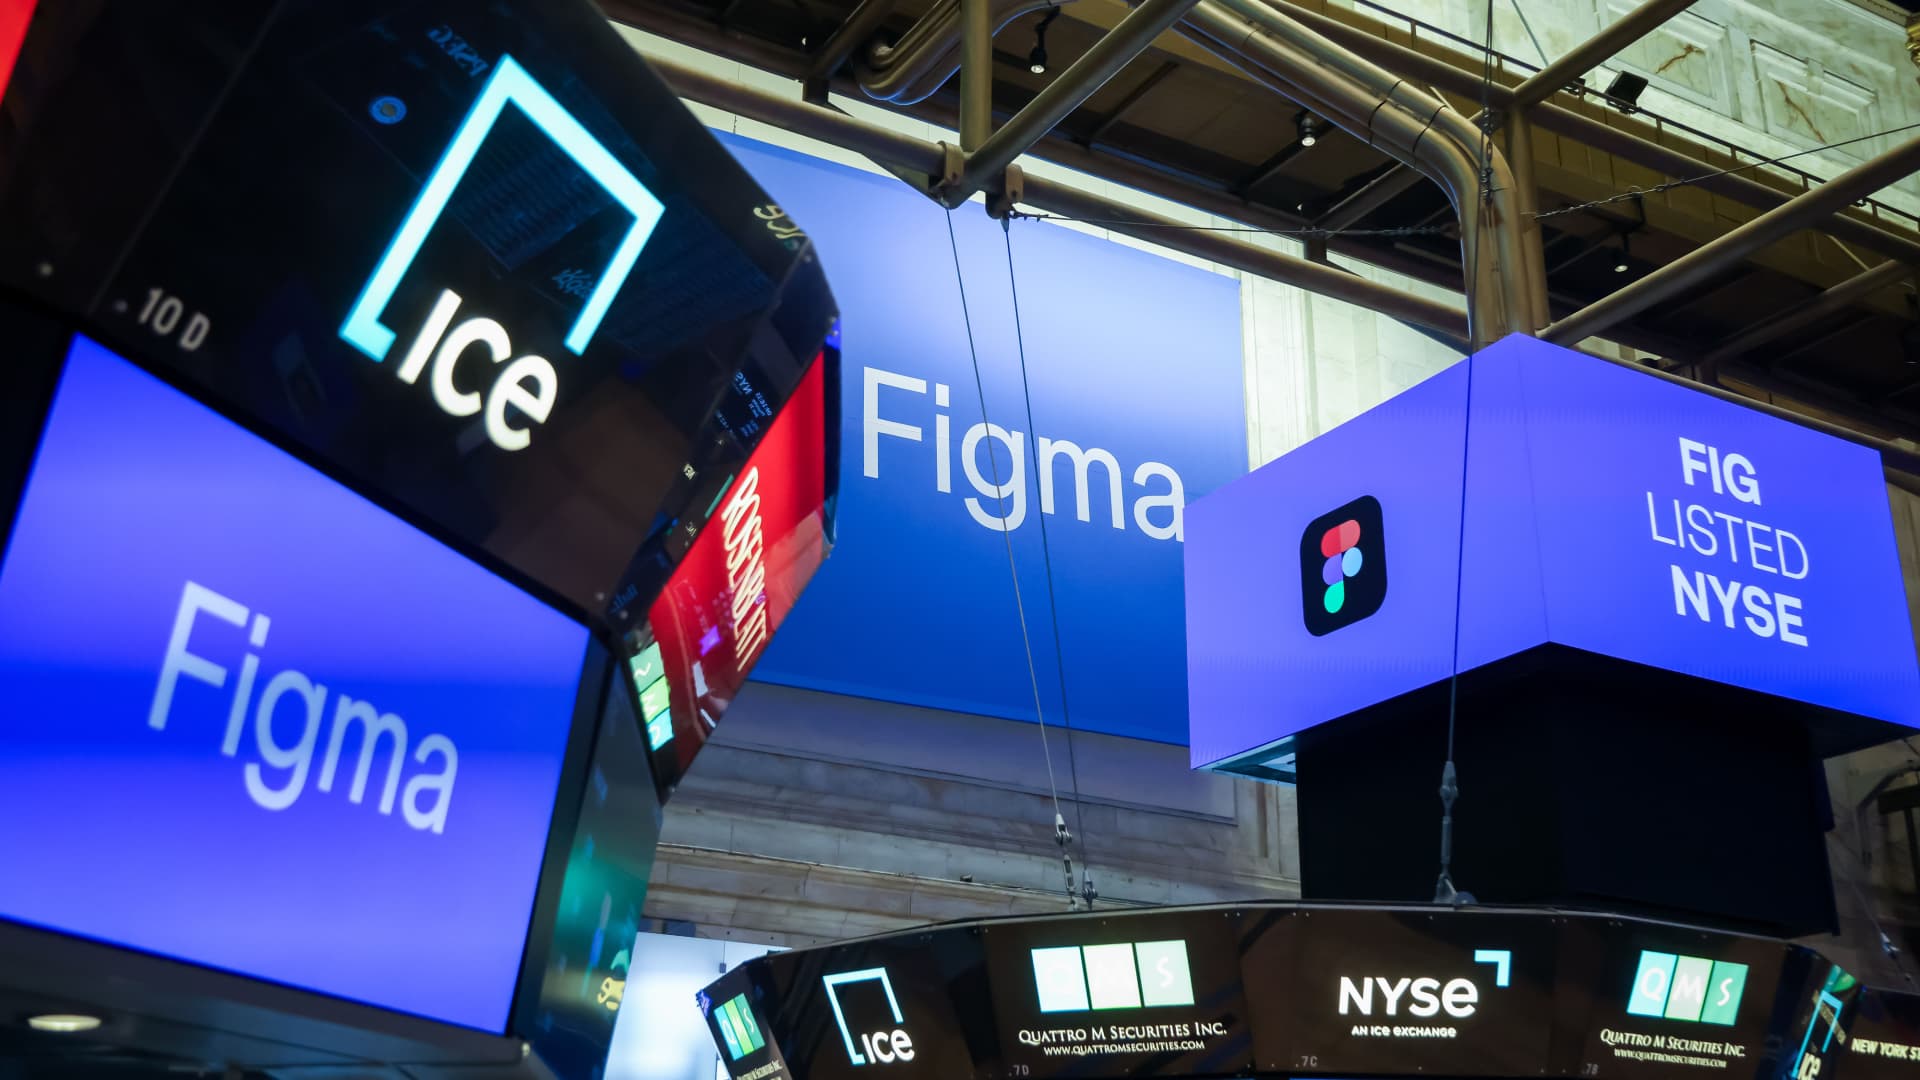
Figma stock is showing weakness. Why are FIG shares declining?
Why Bank of America Sees Potential in FigmaBank of America is challenging the bearish AI narrative surrounding Figma, arguing that generative AI is more likely to accelerate demand than disrupt the business. The firm believes AI will increase the need for real-time collaborative product design while creating a new monetization opportunity through Figma’s hybrid pricing model, which combines traditional seat-based subscriptions with usage-based fees.Bank of America recently reinstated coverage with a Buy rating and a $30 price target, saying the market has become overly pessimistic after the stock fell roughly 85% from its 52-week high on concerns that AI could erode its competitive position.The firm’s bullish outlook is also supported by Figma’s growth profile and valuation. BofA forecasts revenue growth of 35.6% in 2026 and 23% in 2027, while valuing the company at about 8 times estimated 2027 enterprise value-to-sales, compared with a peer average of roughly 5.9 times.Figma Stock: Key Levels and Momentum IndicatorsFrom a longer-term trend lens, the stock is still in repair mode after a steep 12-month decline of 81.15%, and it remains pinned well below the 200-day SMA at $31.44 (about 30.5% under that level). The bigger-picture trend also stays pressured by the death cross that formed in January (50-day SMA below the 200-day SMA), which often keeps rallies "sellable" until price can reclaim longer moving averages.Nearer term, price is back above the 20-day SMA ($19.55) and 50-day SMA ($20.65), but it’s essentially battling the 100-day SMA at $22.05 (about 0.9% overhead), a common spot where rebounds stall. That "stuck at the 100-day" setup matters because it can turn into either a base-building breakout (if reclaimed) or a lower high (if rejected).Momentum is improving: MACD is above its signal line and the histogram is positive, which suggests downside pressure is easing versus the prior downswing even if the primary trend hasn’t fully flipped. In plain terms, when MACD is above the signal line, it often means buyers are gaining traction and pullbacks may be shallower than they were earlier in the decline.