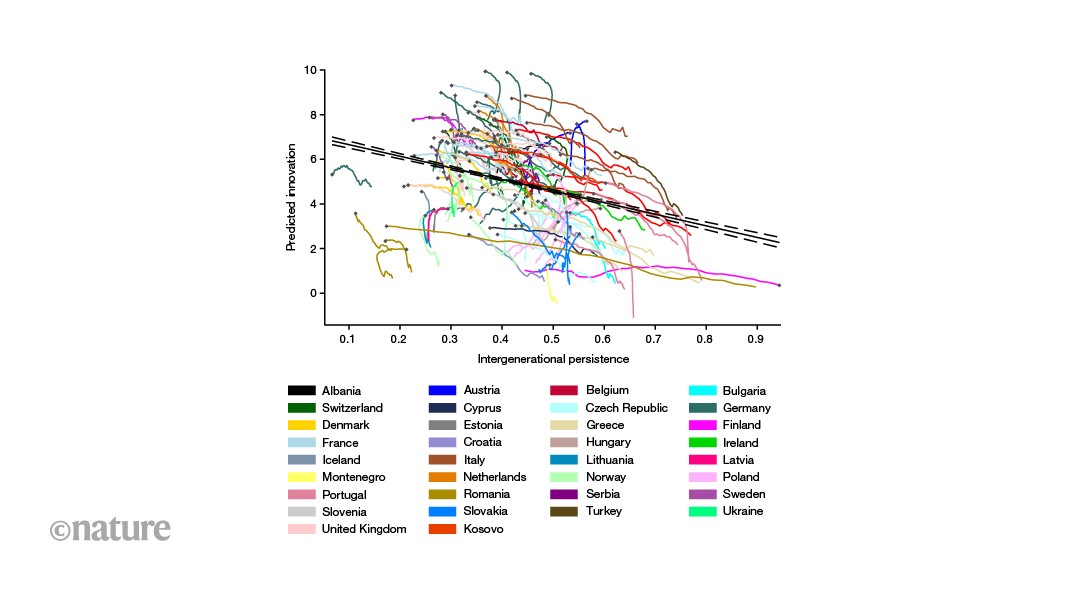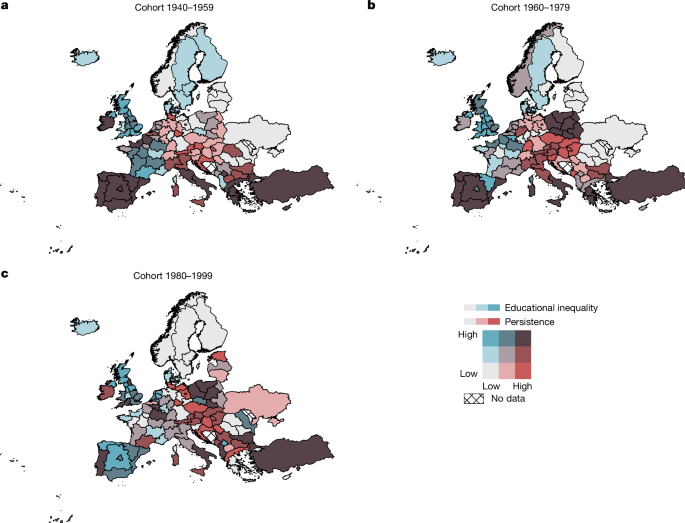
MainThe circumstances into which individuals are born can place fundamental constraints on their future economic opportunities1,2,3,4,5, leading to a mismatch between talent, education and occupation. One major determinant of this inequality of opportunity is the absence of intergenerational mobility of education. If socioeconomic circumstances outside of an individual’s control constrain their educational opportunities, they may not be able to acquire a level of education commensurate with their abilities2. In turn, intergenerational immobility (that is, persistence) of education contributes to the reproduction of economic inequalities if the unachievable educational pathways are positively related to future earnings trajectories3,4,5.Although the decades-long debate in both academia and the policy sphere has largely focused on the individual consequences of inequality6,7,8,9,10,11,12, a more recent strand of research addresses the potential negative implications of intergenerational persistence for aggregate long-run growth and development13,14,15,16. With the misallocation of talent resulting from intergenerational persistence limiting individual productivity to a level below an individual’s productivity potential, aggregate productivity is also likely to be negatively affected. However, owing to a lack of adequate data, the empirical question of how improvements in intergenerational mobility over time affect economic growth and development at a broader scale remains open17.In this Article, we present the EUROPE-IGM-ATLAS database. This database extends existing knowledge on intergenerational mobility of education and its relationship to economic development in two ways. First, building on a recently developed procedure14, we are able to measure changes over time in effective intergenerational mobility by transforming cohort-linked measures into time series indicators, thereby resolving one of the major challenges in estimating the economic implications of intergenerational mobility over time1,16,18. Second, to demonstrate the value of our database in empirical research, we apply it to studying one channel potentially driving the relationship between intergenerational mobility and economic growth, namely innovation. Consequently, our analysis also contributes findings to the emerging literature investigating subnational variations in social mobility across economics, sociology and geography, thereby generating insights across European countries and regions14,19,20,21,22.Using harmonized microdata at the subnational level, we first draw the geography of intergenerational mobility of education in Europe and construct comparable descriptive indices for three birth cohorts over the second half of the twentieth century. We then transform these cohort-linked measures into composite annual measures of effective intergenerational mobility for each region, based on weighted contribution profiles over the lifecycle. Specifically, our EUROPE-IGM-ATLAS database comprises regional annual measures of intergenerational mobility of education, educational inequality and average education from 1985 to 2025 (details on the procedure and a full description of the available indices are provided in the Methods) for 225 microregions (Nomenclature of Territorial Units for Statistics 2 (NUTS 2)) or 108 mesoregions (NUTS 1) within 36 countries. These indices permit cross-national comparisons between regions, as well as a complementary analysis of how intergenerational mobility in Europe has evolved over time. The EUROPE-IGM-ATLAS database therefore offers a valuable resource for studying various potential regional implications of past intergenerational mobility.We then use our database in combination with patent data to analyse the mobility–innovation nexus. Previous suggestive evidence shows that intergenerational mobility is correlated with innovation23,24,25, that parental background and the local environment have an important role in the opportunity structure that determines who becomes an inventor26,27, and that financial constraints based on parental background may harm economic growth by delivering inefficiencies in the allocation of talent and idea production28. Our approach enables us to examine one direction of the relationship between intergenerational mobility and innovation while mitigating concerns about reverse causality. In particular, the observed association is shaped by younger cohorts entering the labour market and accumulating experience, as older cohorts gradually withdraw from the workforce14.Our analysis provides large-scale longitudinal evidence that the positive relationship between intergenerational mobility and innovation holds across European regions over time, while exhibiting marked heterogeneity within major historically entrenched innovation hubs. These results hold even after we control for the broader structure of educational opportunities by including differences in average education and educational inequality across cohorts and regions. Further analyses suggest that the observed relationship may be nonlinear in nature, with the largest innovation gains arising at low to intermediate levels of mobility.Geography of intergenerational mobilityWhen we apply our estimation procedure (Methods), the EUROPE-IGM-ATLAS reveals several spatiotemporal trends that characterize the changing geography of inequality of opportunity in Europe. We find that observed increases in intergenerational mobility primarily stem from improvements in educational achievements among individuals from families at the lower end of the educational distribution, with fewer changes in rank across the educational spectrum. At the NUTS 1 level, and for the cohorts born in 1940–1959, 1960–1979 and 1980–1999, educational persistence between generations (as measured by the slope coefficient of a regression capturing the degree of association between parental years of education and the education of their children) decreased by 0.104 (from 0.459 to 0.355; paired t-test, t-statistic = 5.959, P < 0.001; 95% confidence interval (CI) = 0.070–0.139; n = 117 NUTS 1 regions) between the oldest and youngest cohorts, on average, indicating that mobility increased over the second part of the twentieth century.However, returns to education fluctuate over time and across economies, meaning that greater educational attainment, while valuable in itself, might not automatically translate into improved economic well-being. Thus, we introduce an additional mobility indicator that accounts for these nuances. The change in mobility as measured by standardized persistence, which specifically captures alterations that affect the relative positions of families within the localized distribution of education, exhibits a minor, statistically insignificant shift (an average decrease of 0.015, from 0.415 to 0.400; paired t-test, t-statistic = 1.157, P = 0.250, 95% CI = −0.011–0.042; n = 117 NUTS 1 regions). This result is consistent with findings from other world regions17,29,30.However, these increases in mobility are not uniformly spatially distributed. Figure 1 illustrates the geography of intergenerational mobility of education in Europe at the regional level, using the cohort-level measures. To offer a more nuanced understanding, the figure connects intergenerational mobility, measured by the slope coefficient (persistence), to educational inequality, measured by the coefficient of variation in years of schooling for each region and cohort pair. This figure, which presents the terciled distributions of these two measures, can broadly be understood to be the ‘Great Gatsby’ map for Europe, in the spirit of Corak’s popularized graph4 widely known as the Great Gatsby curve.Fig. 1: The geography of intergenerational mobility and educational inequality in Europe.a–c, The bivariate distribution of intergenerational mobility (persistence; as measured by the slope coefficient) versus educational inequality (measured by the coefficient of variation for education) for the 1940–1959 (a), 1960–1979 (b) and 1980–1999 (c) cohorts. Higher slope coefficient values indicate higher levels of intergenerational persistence (that is, immobility). The axes indicate terciles, and the results are reported at the NUTS 1 level with the addition of Ukraine and Türkiye. The use of terciles demonstrates relative changes in position between the three periods. Sources: European Social Survey (ESS) 2002–2023; European Commission (Eurostat/GISCO), under a CC BY 4.0 licence; and ESRI, Garmin International, US Central Intelligence Agency (The World Factbook) and the National Geographic Society. Shapefiles were modified to include non-NUTS regions (Supplementary Fig. 4).Regions with lower levels of intergenerational mobility (that is, higher levels of persistence) tend to also exhibit a relatively high degree of educational inequality, implying the co-existence of inequality both within and between generations. The Pearson correlation between intergenerational persistence and inequality in years of education across all cohorts is substantial; 0.62, 0.47 and 0.41 at the country (P < 0.001, n = 114), NUTS 1 (P < 0.001, n = 351) and NUTS 2 (P < 0.001, n = 674) levels, respectively (average estimates of persistence and standardized persistence for each cohort and country are shown in Supplementary Tables 1 and 2). Notably, country borders are clearly visible in Fig. 1, indicative of geographical discontinuities in intergenerational mobility and educational inequality. This suggests that factors that act at the country level have an important role in determining intergenerational mobility and educational inequality. The estimates also reaffirm the differences between Central and Northern Europe versus Southern and Eastern Europe, with the former having higher mobility and lower inequality, and the latter having lower mobility and higher inequality17,29. These differences largely persist over time. The figure also reveals a notable degree of heterogeneity in intergenerational mobility within countries.Furthermore, after transforming the cohort-level measures into composite annual measures of effective mobility using weighted contribution profiles over the lifecycle (Methods), we find that educational inequality has not substantially converged between European countries since 1985, despite relative improvements within countries over time. Between 1985 and 2020, the relative dispersion (or the ratio of the s.d. to the mean multiplied by 100) of educational inequality decreased by 2.7 and 6.8 percentage points at the cross-country level and NUTS 1 regional level, respectively (Extended Data Fig. 1). Conversely, we find evidence of a greater degree of convergence in intergenerational persistence at the country level than between regions. As Fig. 2 illustrates, over the past four decades, the relative dispersion of persistence decreased by 3.6 and increased by 0.96 percentage points at the cross-country level and NUTS 1 regional level, respectively. This regional heterogeneity underscores the importance of using this variability at the subnational level to investigate the link between intergenerational mobility and economic performance.Fig. 2: Distributional changes in persistence in Europe.a,b, Depiction of how effective persistence, weighted according to profile I cohort-participation weights (Methods), has changed in Europe over the past four decades, from 1985 to 2020. a, The effective persistence at the country level in its annualized form. n = 1,296. b, The first and last observation of effective persistence at the NUTS 1 level. n = 107. a, On the basis of the annualized measures of effective persistence, persistence has not converged between European countries since 1985. b, However, the dispersion of persistence has decreased comparatively more than at the regional level. Source: ESS 2002–2023; profile I weights are derived from life-cycle labour participation profiles (Methods).Intergenerational mobility and innovationIn this section, we test the relationship between effective intergenerational educational mobility and innovation. To maximize subnational variation in our measures of intergenerational educational mobility, we conducted the analysis at an augmented NUTS 1 level that incorporates NUTS 2 distinctions in cases in which the NUTS 1 region corresponds to an entire country (Methods). The baseline sample (n = 233,057 observations) that we used to construct the annualized regional indices at the augmented NUTS 1 level for this application (n = 137 regions, year t = 1992 to 2020 for regions encompassed by the former Warsaw pact and 1985 to 2020 for all other regions; Methods) excludes first-generation migrants to avoid bias arising from selective international migration to high-mobility or high-innovation areas. To measure the level of regional innovation, the dependent variable, we used the inverse hyperbolic sine transformation of three measures of regional patenting activity; patent count, granted patent count and citation-weighted patent count (Methods). Over the past four decades, there has been substantial variation in regional trajectories for these measures, as illustrated in Extended Data Fig. 2.Table 1 presents our preferred estimates, whereby the degree of intergenerational persistence, the main independent variable, is measured by the slope coefficient, and innovation is measured in terms of patent count. The relationship between persistence and innovation is consistently negative (two-sided Wald tests, P < 0.002 for all specifications), even after we control for a range of potential covariates (Supplementary Table 3; correlation coefficients for the covariates are presented in Supplementary Table 4). Equivalently, our results show that higher levels of intergenerational mobility (that is, a weaker association between parents’ and children’s education) are strongly associated with more innovation. With the inclusion of covariates, the coefficient of interest decreases in magnitude, but nevertheless remains both statistically significant and substantial in size (preferred specification coefficient in Table 1 (column 3), −1.997; two-sided Wald test, z = −5.29, P < 0.001, 95% CI = −2.737 to −1.257, n = 4,623). This relationship holds even in our more parsimonious model specifications, which incorporate region and time fixed effects or country-specific time trends (coefficient in Table 1 (column 4), −0.928; two-sided Wald test, z = −3.03, P < 0.002, 95% CI = −1.528 to −0.328, n = 4,623) that greatly contribute to explaining the variation in the number of patents (as evidenced by the notable increase in the adjusted R2 values, from 0.269 without fixed effects or time trends in Table 1 (column 2) to 0.968 (column 4)).Table 1 Intergenerational mobility and innovation at the augmented NUTS 1 levelFull size tableTo interpret the size of this association, we estimate the elasticity derived from the point estimate31. A decrease in the slope coefficient by 0.1, which is very close to the average change experienced by European regions from the oldest to the youngest cohort in our sample, is associated with a positive change in the number of patents of between 4% and 23% (Table 1).Alternative specifications estimated, for example, using (1) granted patents and citation-weighted patents as the dependent variable; (2) standardized persistence as the main independent variable; (3) alternative weighting schemes when constructing the annualized measures of mobility; and (4) mobility indices computed based on alternative samples that additionally exclude or include those with a migration background (Supplementary Tables 6–10, respectively) are robust and consistent with the results in Table 1.The results of a further series of tests, considering the three different definitions of the dependent variable (patent count, granted patent count, citation-weighted patent count), the two measures of intergenerational persistence (persistence and standardized persistence), the iterative inclusion of covariates (described in Supplementary Table 3) corresponding to seven regression specifications (Supplementary Table 5), five weighting profiles and using two different samples to construct the cohort-level measures of intergenerational persistence ((1) excluding first-generation migrants only; and (2) additionally excluding individuals with a migration background, respectively), are reported in Extended Data Fig. 3. Overall, we obtained 420 additional estimates, and corresponding elasticities, for (1) all specifications and (2) our preferred specification (Table 1 (column 3)).Of all estimates, approximately 89% are negative and significantly different from zero (that is, two-sided Wald tests with P < 0.1), with an average elasticity of around 14%. For our preferred specification, all estimates are negative and significant (two-sided Wald tests with all P < 0.01), with a slightly lower average elasticity of around 11%. In Extended Data Fig. 4, we demonstrate how the iterative inclusion of controls affects these estimates. In general, we provide robust evidence that the positive impact of improved intergenerational mobility on innovation is both substantial and economically significant.As an additional validation of our results, we also consider an alternative estimator designed for handling non-negative count-dependent variables, such as patents (Methods). When we replicated the series of tests with this alternative estimator (Supplementary Fig. 5), the negative relationship between persistence and innovation held for the majority of estimates, although for a smaller share (approximately 52%, two-sided Wald tests with P < 0.1) than with our main estimator. Notably, further analyses (Supplementary Fig. 6) reveal that the presence of statistically insignificant or positive estimates is primarily driven by major innovation hubs, that is, European regions within the top 10% of the patent count distribution throughout our observation period. Among this subsample of innovation hubs, and when we apply both estimation procedures, the obtained coefficients and corresponding elasticities are rather dispersed with a high s.d. In contrast to the results for the regions outside of these hubs, those associated with these historically entrenched innovation hubs point to a weak or even negative relationship between intergenerational mobility and innovation.There are several potential explanations for this localized heterogeneity. First, major innovation hubs did not emerge during our observation period; rather, they are the outcome of decades-long historical development processes driven by factors that predate our analysis32,33,34. Although intergenerational mobility might have been one of these factors, it no longer appears to be a key driver of innovation at extremely high levels of patenting activity. Second, building on this perspective, the mechanisms through which intergenerational educational mobility affects innovation may fundamentally differ between innovation hubs and non-hubs. Mechanically, a higher level of educational mobility allows more individuals to acquire the skills necessary for participating in innovation. In non-hubs, disadvantaged individuals with high latent ability, who were previously structurally excluded, are then able to engage in patenting activities. By contrast, in hubs, the local talent pool is probably already large enough such that innovation outcomes in these regions depend more strongly on agglomeration economies, dense knowledge spillovers, the concentration of highly productive inventors and the broader institutional and policy environment35. This interpretation is consistent with existing evidence that shows that both growth and frontier innovation are disproportionately driven by upper-tail knowledge rather than by increases in average human capital36.Third, the strongly skewed distribution of inventor productivity may also have a role, with previous literature documenting that (1) a very small fraction of inventors and scientists accounts for a disproportionate share of patents and scientific production37,38,39; and (2) highly productive inventors disproportionately come from advantaged family backgrounds, reflecting the intergenerational transmission of human capital, early exposure to innovative environments, and privileged access to elite educational and professional networks27,40,41. In innovation hubs, rising intergenerational mobility may therefore alter the compositions of inventor cohorts and therefore lead to a temporary decline in patenting growth. Taken together, these mechanisms help to explain why, in major innovation hubs, the relationship between educational mobility and patenting activity may be statistically insignificant or even negative.Finally, we conducted two analyses that investigate potential nonlinearities in the relationship between intergenerational educational mobility and innovation. First, we tested whether the average association between persistence and innovation is related to the initial level of intergenerational persistence. Figure 3 illustrates the shape of the response functions predicting innovation in response to changes in persistence over time at the regional level, and demonstrates that the slope is steepest for those regions that had higher levels of persistence at the beginning of the observation period (Fig. 3c,d) and in which persistence has improved substantially over time. However, the shape of this relationship differs from the average for those regions that had initially lower levels of persistence (Fig. 3b) (two-sided Wald test for seemingly unrelated regressions, χ2 = 708.52, P < 0.001, n = 4,935). Second, we allow persistence to enter the analysis in a flexible, nonparametric manner by estimating variants of our preferred specification across flexible bins of the independent variable. The estimated outcomes, presented in Supplementary Figs. 7 and 8, confirm the overall pattern suggested in Fig. 3. The marginal returns to intergenerational mobility are increasing for high and medium levels of persistence (that is, when intergenerational mobility is lower), but are diminishing or even slightly revert for low levels of persistence. This evidence suggests that improvements in intergenerational mobility are particularly beneficial for economic performance in more strongly stratified societies in which mobility is low, whereas further increases when mobility is already high do not necessarily reflect additional gains in equality of opportunity or a more efficient allocation of talent.Fig. 3: Intergenerational mobility and predicted innovation at the augmented NUTS 1 level.a–d, Each line represents annual data for a region within a European country. Innovation is predicted on the basis of regression specification 3 in Table 1, where innovation is captured by the inverse hyperbolic sine-transformed patent count. This figure is plotted against intergenerational persistence (the slope coefficient) after application of profile I cohort-participation weights (Methods) for all regions (a) and those regions in the low (b), medium (c) and high (d) terciles of persistence in the baseline period in 1985. The share of regions in each tercile by country is shown in Supplementary Table 17. The markers indicate the most recent observation to indicate the direction of changes in mobility. Each panel also shows the linear regression line of the relationship and the respective 95% CI based on default s.e. values. Source: ESS 2002–2023; profile I weights are derived from life-cycle labour participation profiles (Methods).This pattern may also reflect the existence of distinct phases in the development of educational mobility: (1) an initial phase in which educational attainment is generally low and highly persistent across generations, limiting innovation; (2) a transitional phase, in which younger generations begin to attain higher levels of education than their parents, leading to greater mobility and, potentially, a surge in innovation; and (3) a maturation phase, in which educational expansion means that most of the population completes a higher level of education, on average, and changes in educational persistence are stagnant or even reverse due to saturation or declining returns to education. These results suggest that the positive association between mobility and innovation is strongest during the initial and intermediate phases. One possible explanation is that of rising aspirations, whereby children increasingly envision educational and occupational trajectories beyond those of their parents, which may in turn act as a driver of innovation and productivity42,43.ConclusionsTheoretical models and empirical research suggest that intergenerational mobility is a driver of economic development. Here we present EUROPE-IGM-ATLAS, a longitudinal database of indices for intergenerational mobility in European regions. With this database, we analyse how intergenerational mobility has developed over time at the microregional level and identify substantial regional disparities. Moreover, in an application of our indices, studying the mobility–innovation nexus, we find suggestive evidence that intergenerational mobility fosters innovation—a main driver of economic growth in developed economies44—particularly in regions with low to medium initial levels of intergenerational mobility and which have not (yet) evolved into major innovation hubs.This result is highly relevant for policy stakeholders as it emphasizes the importance of better exploiting the existing talent pool to generate economic growth, underscoring the argument that improving equality of opportunity contributes to a better allocation of talent and abilities, and eventually improves the efficiency of economic systems45,46,47. Our findings are derived from analyses conducted at the subnational level. Thus, although we cannot entirely dismiss the potential influence of unobserved sources of heterogeneity not accounted for in our estimations, these findings, along with the data source that we provide, substantially contribute to our understanding of the relationship between intergenerational mobility and economic performance.The EUROPE-IGM-ATLAS database opens up various paths for future research. The indices that we developed enable researchers to measure effective intergenerational mobility of education, educational inequality and average education over time and space, thereby filling a major gap in existing databases. As a further contribution with respect to previous studies, we provide three different versions of our mobility indices, based on different samples: (1) including only individuals born in their country of residence; (2) excluding all individuals with a migration background; and (3) including all migrants. The indices have great potential in various empirical applications that aim to study the relationships between equality of opportunity, economic inequality and indicators of socioeconomic development at multiple spatial scales.MethodsMaterialsThe first stage of this paper, the construction of the EUROPE-IGM-ATLAS, relies on harmonized cross-country individual-level survey data. The second stage, an application of our database in which we use the indices to investigate the relationship between intergenerational mobility and innovation, relies on aggregate datasets from several sources discussed below. These include proxies for innovation and localized controls for initial economic conditions.To estimate intergenerational mobility of education, we use 11 waves of the ESS conducted between 2002 and 2023. The ESS is a representative cross-national survey in which 40 countries have participated in at least one round since the 2002/2003 wave. Importantly, it includes questions about the level of education and retrospective questions on parental education, therefore enabling us to measure intergenerational mobility while avoiding the bias associated with selectivity in co-residency samples49. We pool all survey waves and apply survey design weights, normalizing the weights to make them consistent across waves30. Furthermore, we restrict our sample to respondents who were at least 22 years old, and were therefore likely to have completed their education, when the survey was conducted. The analysis could be sensitive to this restriction if individuals had not yet completed their educational career. Suitable robustness checks imposing different age restrictions (for example, older than 25) yield no significant changes in the resulting estimates.We operationalize our definition of migrants in two ways; (1) first-generation migrants, who were not born in their country of residence; and (2) second-generation migrants, those with an indirect migration background either because their parents were first-generation migrants or because they do not possess the citizenship of their country of residence. We use these definitions to construct three versions of our indices: (1) excluding first-generation migrants only; (2) excluding both first- and second-generation migrants; and (3) including migrants. As migration could be endogenously related to both human capital allocation and economic performance within regions50, in our main application, we use the version of our indices obtained by excluding first-generation migrants, giving us a total sample size of 257,919 individuals. Estimations based on the two alternative samples (that is, the sample excluding individuals with a migration background and the one including both natives and migrants) yield consistent results (Supplementary Table 10). In general, see Supplementary Table 11 for clarification on database versioning.To compute estimates at the subnational level, we use information about the region of residence of ESS respondents (that is, their geographical location of residence in adulthood at the time the survey was conducted). Regional information in the ESS is recorded using country-specific administrative codes that correspond to varying levels of the NUTS (Nomenclature of Territorial Units for Statistics) classification system. Participating countries provide regional identifiers at different hierarchical levels, with some countries coding at NUTS 1, some at NUTS 2, and others at NUTS 3. Moreover, there have been temporal changes in NUTS boundaries, particularly at smaller spatial scales. This creates substantial heterogeneity in regional granularity both within and across survey waves.To achieve consistent cross-national and cross-temporal comparability, we implement a harmonization procedure. We compute estimates at both the NUTS 1 and NUTS 2 levels where possible. Thus, for countries who code at the NUTS 3 level, we aggregate upward. For regions where NUTS 2 boundaries changed substantially between survey rounds, we do not provide NUTS 2 level estimates, instead further aggregating to the more stable NUTS 1 classification to preserve temporal consistency. The version of the NUTS that serves as the basis of our harmonized definition of regional unit is the 2016 version, with the exception of Poland—which is included based on the 2008 NUTS boundaries due to regional divisions in later versions of NUTS. Our definition of regional boundaries is further augmented by the addition of non-EU countries, such as Serbia, Kosovo, Montenegro and so on. A cartographical depiction is shown in Supplementary Fig. 4.The NUTS classification system is particularly useful for cross-national and cross-regional comparability purposes due to the statistical consistency of NUTS units. However, it is important to note that NUTS regions may not always align with regional policymaking structures.Measuring innovationTo measure regional innovation, our main outcome variable of interest, we rely on patenting as an established indicator of innovation performance51. We retrieve patenting data from the European Patent Office’s (EPO) Worldwide Patent Statistical Database (PATSTAT, version 2024a) and construct three hierarchical measures of regional innovation: (1) patent count as a proxy for the regional quantity of innovation activities regardless of their quality; (2) granted patent count as a proxy for the regional quantity of innovation that surpasses a certain legal quality threshold; and (3) citation-weighted patent count, as a proxy for the economic value of regional innovation. In constructing these measures, we closely follow relevant guidelines and the prior literature52,53.Specifically, we focus on EPO and World Intellectual Property Office (WIPO) filings, prioritizing EPO filings over WIPO filings. We consolidate applications at the patent family level and select the earliest filing year as the year of invention. To assign patents to NUTS regions, we use information from PATSTAT on geocoded patent inventor locations, which reflect the location where the innovation activity took place. If a patent lists inventors from more than one region (for example, one from region A and another from region B), we apply fractional counting (that is, we assign 0.5 of the patent to region A and 0.5 to region B). We consider all patent applications from 1985 (the first year available with a one-year lag in our contemporary controls, see the ‘Covariates’ section) until 2020 (the last year that ensures a complete citation window for all patents when constructing citation-weighted patent count, given availability in the 2024a version of PATSTAT).Our three innovation measures are formally defined as follows. First, raw patent counts are the unweighted, fractional count of patent applications54:$${\mathrm{PC}}_{{rt}}^{\mathrm{RAW}}=\mathop{\sum }\limits_{p=1}^{{N}_{{rt}}}{z}_{{pr}}$$
Intergenerational mobility fosters innovation in Europe - Nature
The EUROPE-IGM-ATLAS reveals spatiotemporal trends that characterize the changing geography of opportunity in Europe and its relationship with regional innovation.
11,764 words~53 min read