T1 Energy stock is trading in a tight range. What’s next for TE stock?
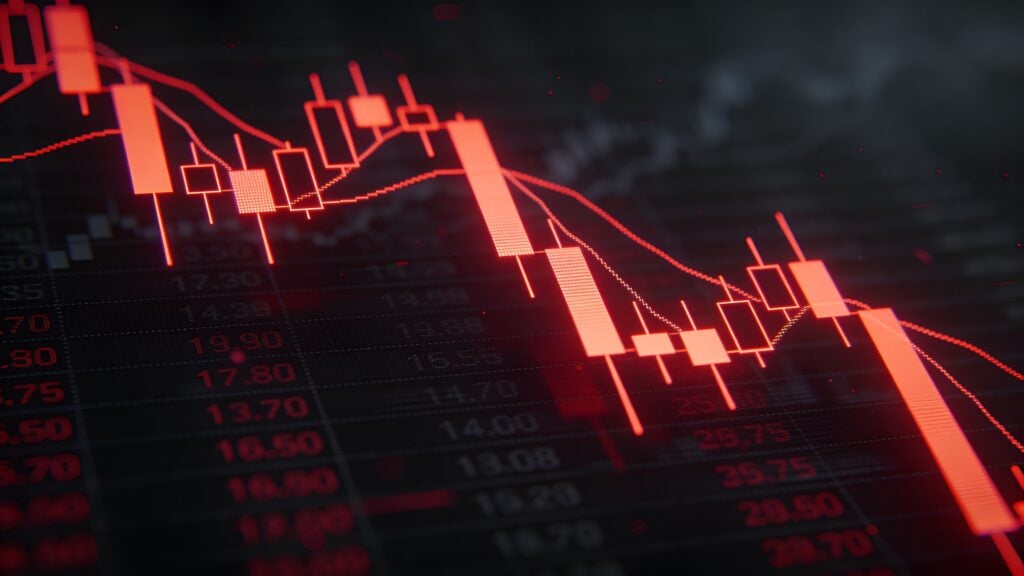
What Is Driving T1 Energy’s Recent Selling Pressure?The latest selling wave is tied to renewed questions about the durability of AI infrastructure spending after Samsung Electronics Ltd previewed Q2 results showing operating profit of about 89.4 trillion won (roughly $59 billion) on revenue of around 171 trillion won. Even with that jump from 4.68 trillion won in operating income in the same period of 2025, the market focus has shifted to whether the AI capex cycle is starting to cool.A separate Reuters angle also added to the caution: DeepSeek is reportedly working toward a custom inference-focused processor, which has fueled worries that big AI labs could rely less on third-party chips over time.With futures pointing lower, the premarket tape is leaning "risk-off," and that tends to amplify downside in higher-beta names that have been trading as part of the broader AI trade.TE Stock: Key Levels and Momentum IndicatorsFrom a trend perspective, TE is still holding above its longer-term baseline but has clearly lost short-term traction: the stock is trading 22.1% below its 20-day SMA ($8.74) and 14.5% below its 50-day SMA ($7.97). It’s also 3.4% below the 100-day SMA ($7.05), while remaining 11.4% above the 200-day SMA ($6.11), which is why the chart reads as "pullback inside a bigger uptrend" rather than a clean breakdown—so far.Momentum is the bigger issue right now: MACD is below its signal line and the histogram is negative, which typically means rallies are having trouble sustaining because upside pressure is fading versus that baseline. If buyers can’t push price back above the 50-day area, the path of least resistance often stays lower until momentum resets.