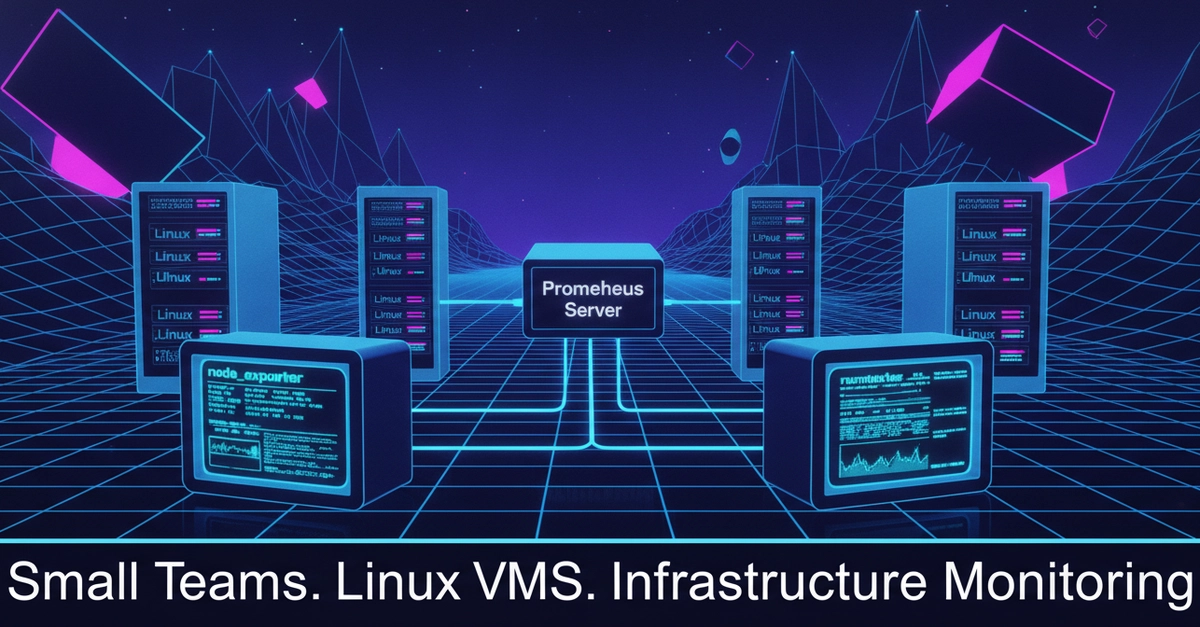
If you've been monitoring Linux servers for any length of time, there's a good chance node_exporter was the first thing you installed. It's lightweight, reliable, and exposes a huge amount of machine metrics for Prometheus to scrape. For years, it has been the default answer.
As your infrastructure grows, though, your monitoring stack usually grows with it. First comes log collection. Then traces. Before long you're running node_exporter, a log shipper, and maybe another telemetry agent. Each component has its own configuration, service unit, upgrade cycle, and failure modes.
Grafana Alloy changes that by consolidating those responsibilities into a single telemetry agent.
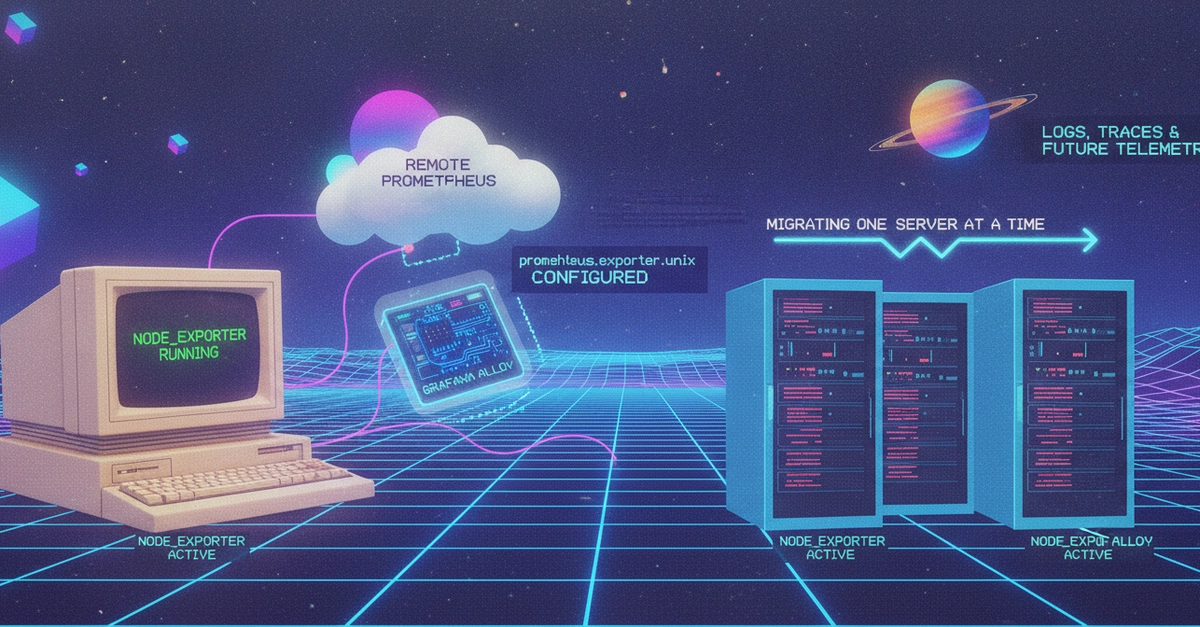
This post walks through migrating from node_exporter to Alloy on a real fleet, one server at a time, while maintaining continuous visibility throughout the process. These are the exact steps that survived contact with production on the Irin monitoring stack, not the idealized version that looks clean in a diagram.
TL;DR If you're already running node_exporter, don't replace it overnight. Install Grafana Alloy alongside it, configure Alloy's built-in prometheus.exporter.unix component, verify that metrics are reaching your remote Prometheus instance, and only then retire node_exporter.