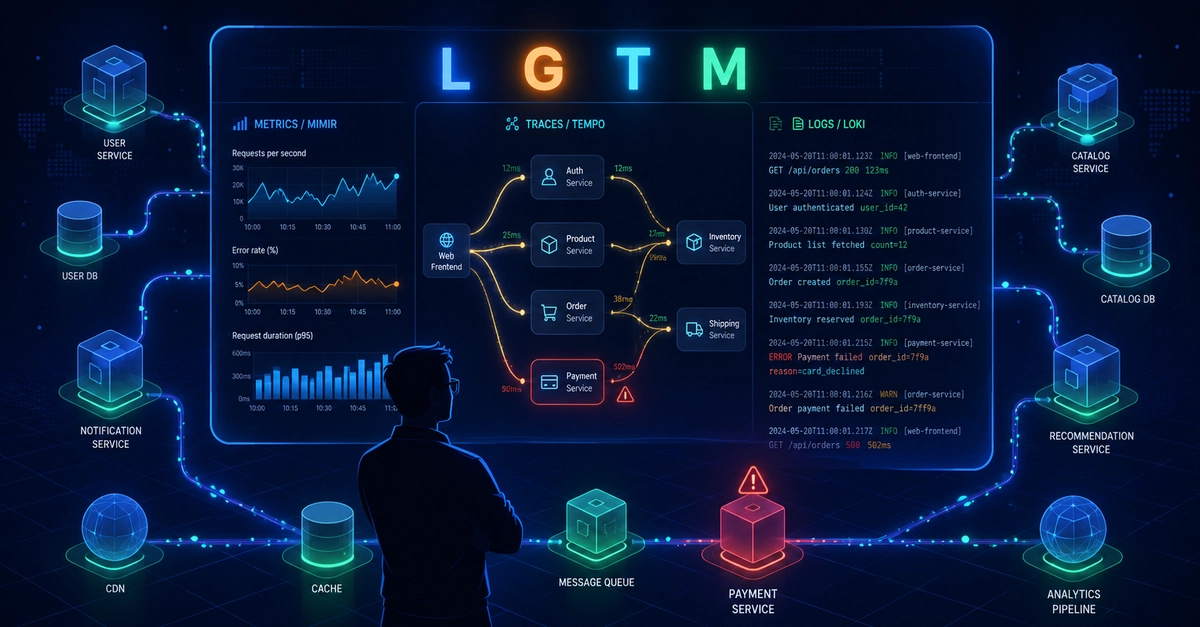
The standard observability stack:
Grafana + Loki + Tempo + Prometheus. Four services to deploy, four configs to learn, dashboards to set up before you see a single trace.
What I actually needed:
One place to see traces, logs, and metrics from my services.
What I built: